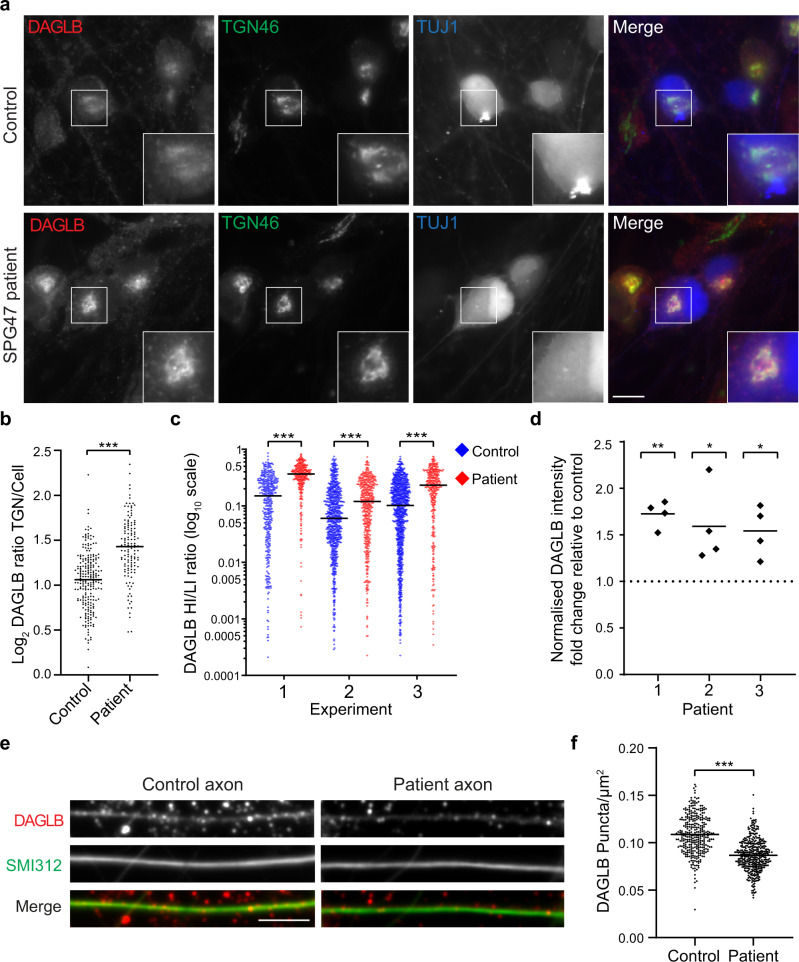
Fig. 6. DAGLB is missorted in iPSC-derived cortical neurons from AP-4-deficient patients.
iPSCs from patients with AP4B1-associated AP-4 deficiency syndrome (SPG47) and their unaffected same sex heterozygous parents (control) were differentiated into cortical neurons. a Widefield imaging of immunofluorescence triple labelling of DAGLB (red), TGN46 (green) and TUJ1 (a marker to distinguish neurons from co-cultured astrocytes; blue) in iPSC neurons from patient 1 and their matched control. DAGLB signal was increased at the trans-Golgi network (TGN) in the AP-4 patient cells. Scale bar: 10 μm. b Quantification of the ratio of DAGLB labelling intensity between the TGN and the rest of the cell, in the cells shown in (a). The experiment was performed in technical triplicate and the graph shows combined replicate data: each datapoint indicates the log2 ratio for an individual cell (horizontal bar indicates median; n = 227 cells for control; n = 129 cells for patient). Data were subjected to a two-tailed Mann–Whitney U-test: ***p ≤ 0.001 (p = 6.7 × 10⁻²⁰). c High-throughput confocal imaging was used to assay the distribution of DAGLB in iPSC-derived neurons from patient 1 and their matched control. Neurons in 96-well plates were labelled with antibodies against DAGLB, GOLGA1 (a TGN marker) and TUJ1. The ratio between the area of high intensity (HI; overlaps with TGN) and low intensity (LI) DAGLB labelling was quantified from three differentiations per cell line (biological triplicate; plotted separately): each datapoint indicates the ratio for an individual cell, plotted on a log10 scale (horizontal bar indicates median; experiment 1/2/3: n = 417/786/999 cells for control; n = 306/464/339 cells for patient). Data were subjected to a two-tailed Mann–Whitney U-test for comparison of the patient and control within each differentiation: ***p ≤ 0.001 (1: p = 2.4 × 10−37; 2: p = 7.2 × 10⁻¹⁰; 3: p = 3.2 × 10⁻²³). Comparable results for another SPG47 patient (patient 2) are shown in Supplementary Fig. 5b. d Western blotting was used to quantify the level of DAGLB in whole-cell lysates from iPSC-derived neurons from three patients with SPG47 and their unaffected same sex heterozygous parents. Data are from n = 4 differentiations per cell line, and the graph shows fold change in normalised DAGLB intensity in the patient relative to control (horizontal bars indicate mean). Log-transformed absolute normalised intensity values were subjected to a two-tailed paired t test for comparison of each patient with their matched control: **p ≤ 0.01; *p ≤ 0.05 (1: p = 0.001; 2; p = 0.036; 3: p = 0.019). e High-throughput confocal imaging was used to assay the density of DAGLB puncta in axons of iPSC neurons from patient 1 and their matched control. Representative images are shown of anti-DAGLB (red) in axons marked with the axonal marker antibody cocktail SMI312 (green). Scale bar: 10 μm. f Quantification of the number of DAGLB puncta per area (µm2) in axons from patient 1 and their matched control, from high-throughput confocal images as shown in (e). Each datapoint represents the mean number of DAGLB puncta per axon area per image (n = 324 images in the control group and n = 405 images in the patient group, covering 21902 and 25253 axon segments respectively). Data were subjected to a two-tailed unpaired t test: ***p ≤ 0.001 (p = 3.7 × 10−50). Source data are provided as a Source Data file.

