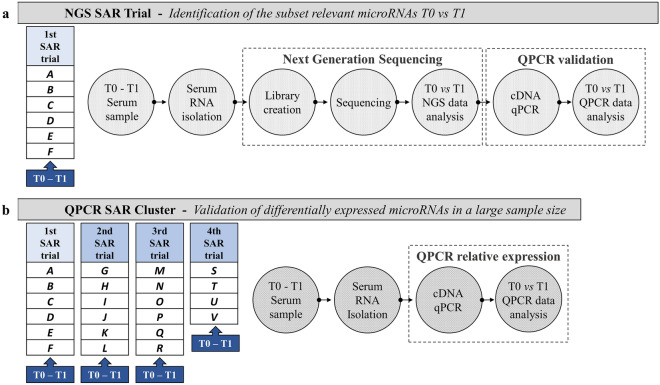
Figure 1.
Research flowchart. The upper part of figure (a) shows the six dogs included in the NGS SAR Trial. The serum of six dogs was collected at two experimental time points (T0 and T1), RNA was extracted and processed for next-generation sequencing miRNome. The figure below (b) shows the second part of the research plan referred to as QPCR SAR Cluster. This part of the study includes blood dog sampling at T0 and T1 of the 2nd, 3rd, and 4th SAR trials. Serum RNA was extracted, reverse transcribed, and only the microRNAs differently expressed, detected in NGS SAR Trial, were validated by qPCR. The figure is created by G. Guelfi using PowerPoint 2021, Microsoft Corporation, USA.

