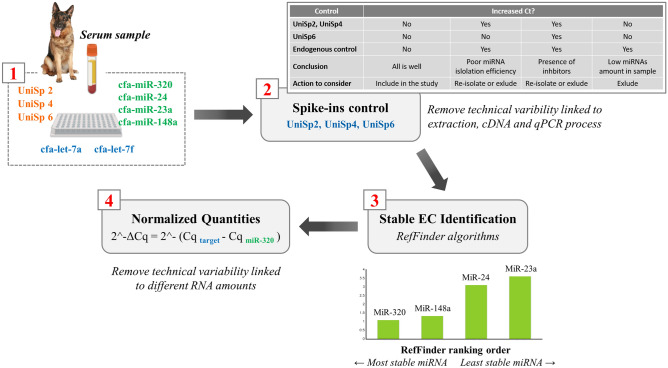
Figure 5.
Control of qPCR data. In all serum sample, qPCR reaction was performed by amplifying 9 targets: let-7a and let-7f differentially expressed miRNAs, UniSp 2, 4, 6 Spike-in, and the EC miR-191, miR-423a, miR-93, and miR-425. UniSp2, UniSp4, UniSp6 enable confident interpretation, first data control (1 red). Spike-ins were compared, and the outlier was detected for sample exclusion or re-isolation. UniSp Cq was interpreted as described by QIAGEN in “Guidelines for Profiling Biofluid miRNA” (summarized in the table). The second data control was miRNAs normalization with the most stable miRNA EC (identified as mir-320). The figure is created by G. Guelfi using PowerPoint 2021, Microsoft Corporation, USA.

