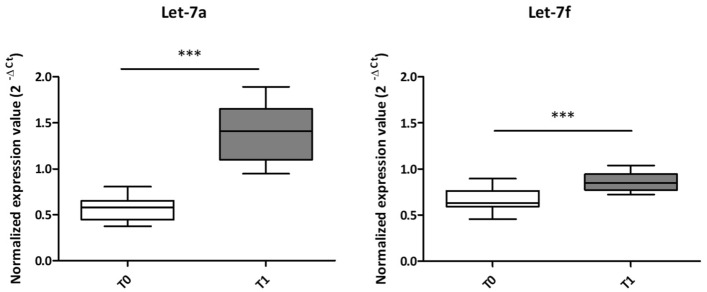
Figure 6.
EcmiRNAs expression levels. The normalized expression values (y-axis) of the let-7a and let-7f ecmiRNAs were calculated with the 2^-ΔCq. The let-7a and let-7f graph show a white box (T0; 22 dog serum samples) and a grey box (T1; 22 dog serum samples). In the box plots, the thick central line represents the median; the top and bottom lines of the box represent the third quartile and the first quartile; whiskers indicate the variability in the data outside the upper and lower quartile. The figure shows the statistical significance of the overlap between the two groups determined using a two-tailed Student’s t-test; ***p ≤ 0.001.

