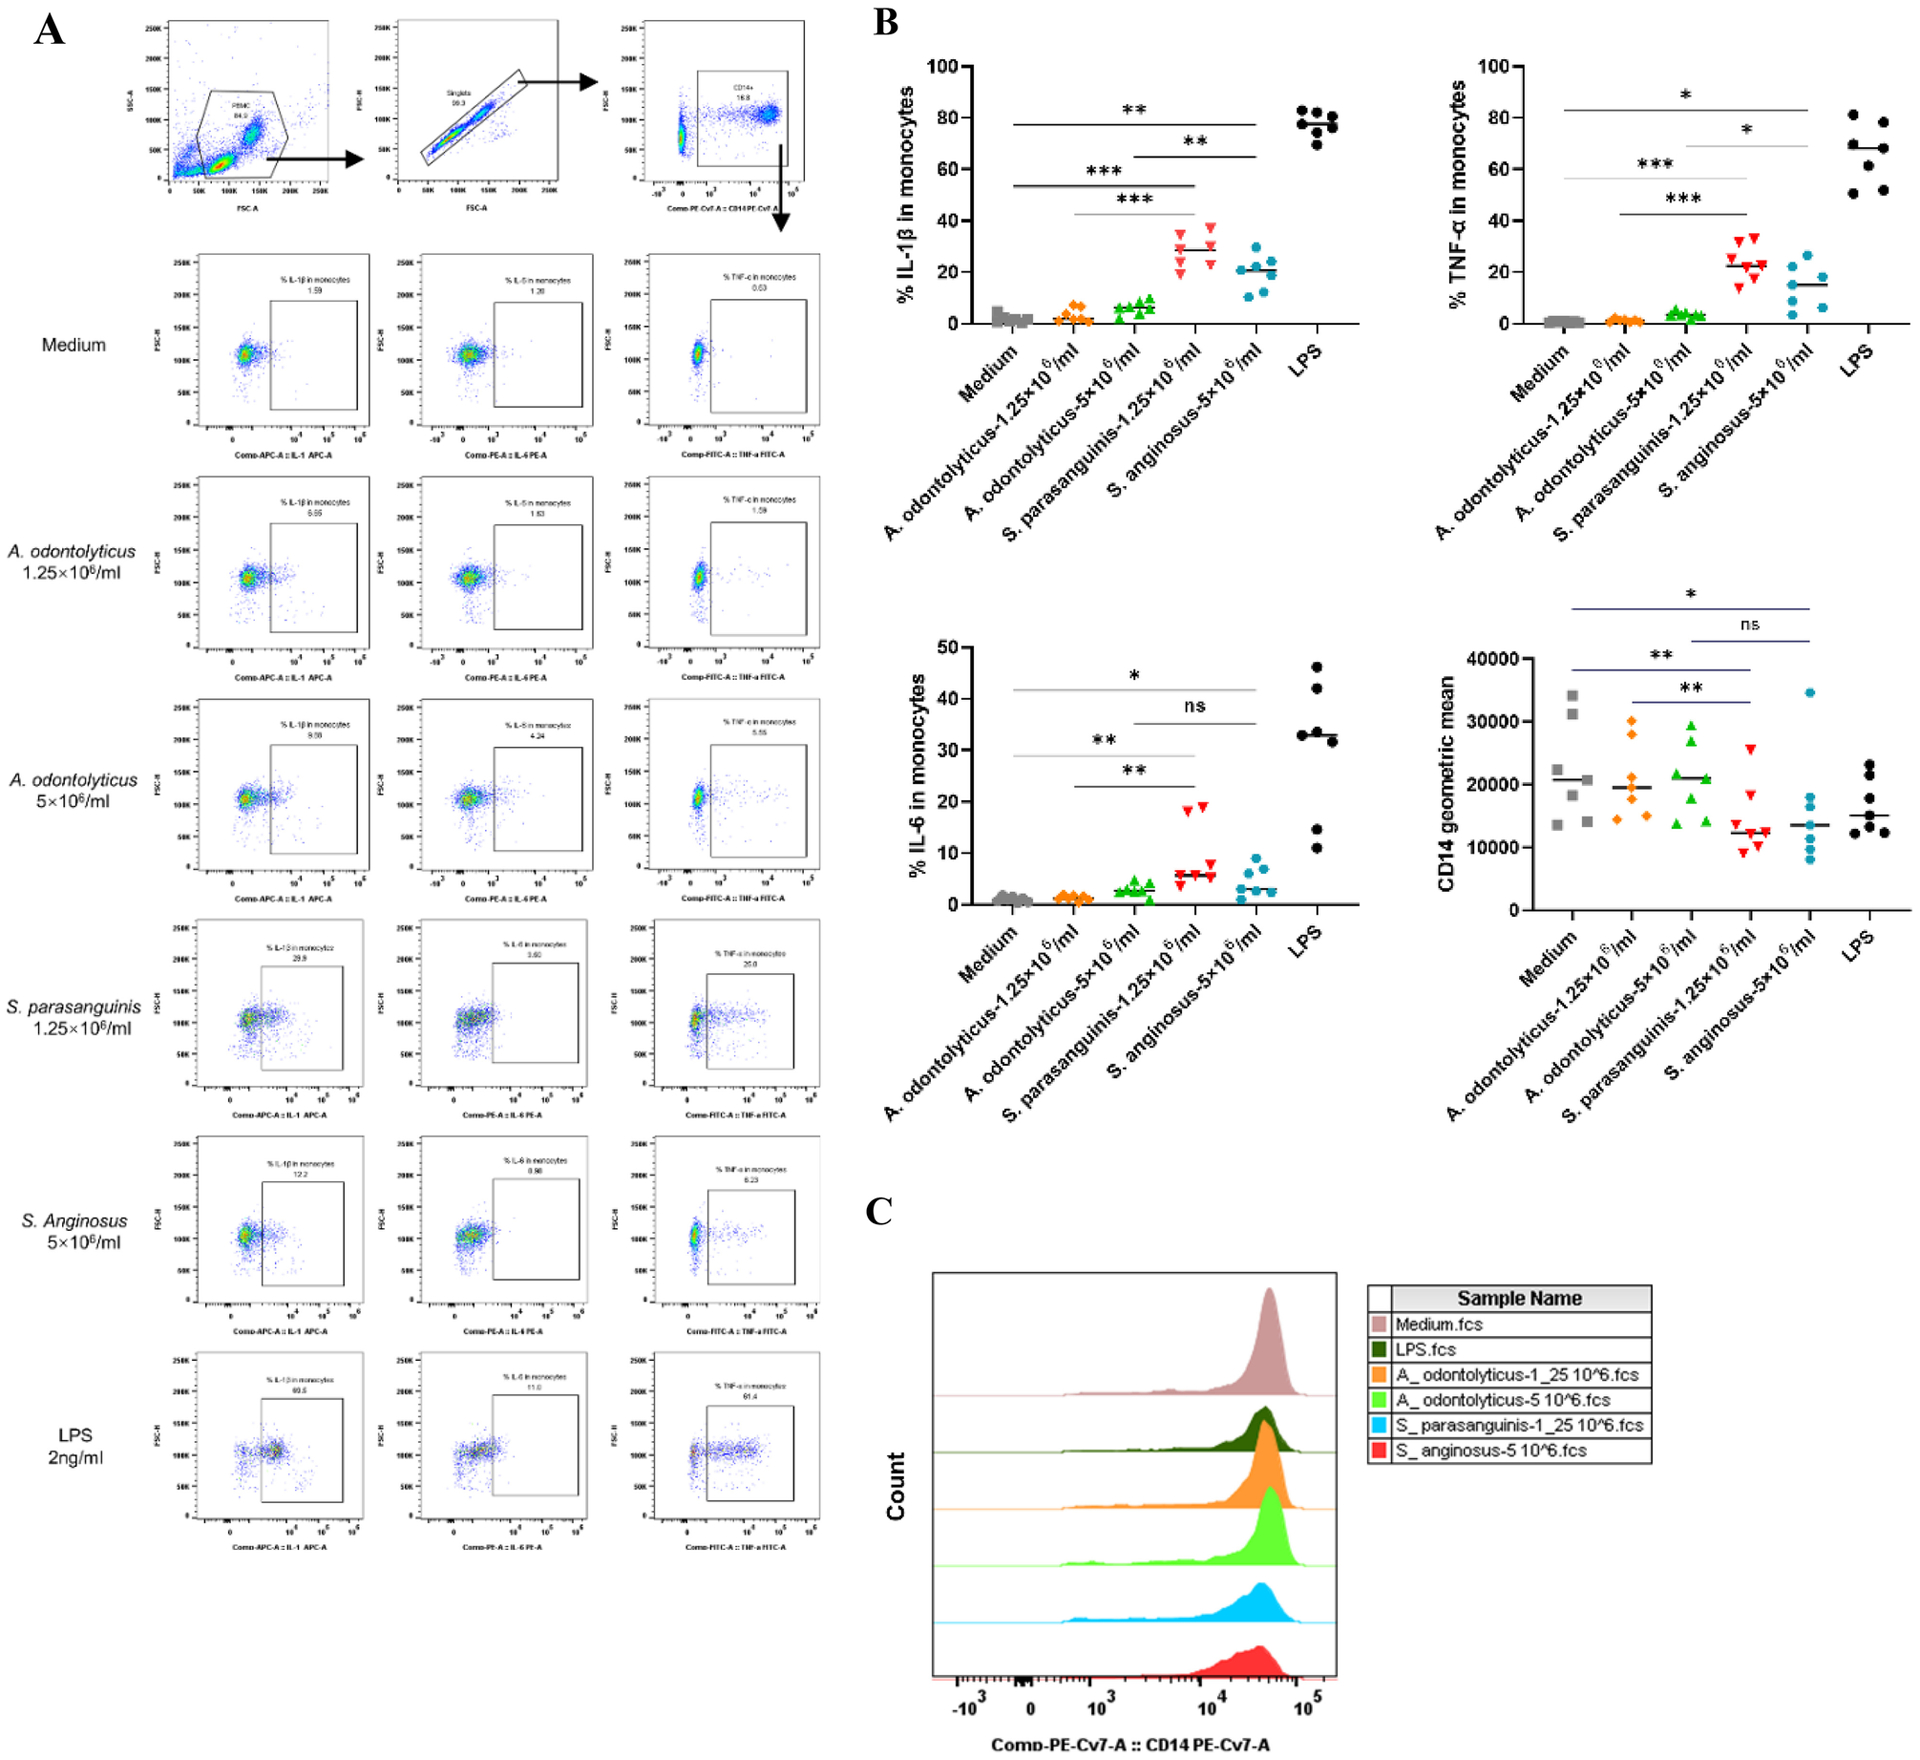
Figure 4. Streptococcus induced intracellular proinflammatory cytokine production in monocytes in vitro.

PBMCs from healthy donors were treated with different concentrations of each bacterial strain for 6 h. The surface glycoprotein CD14 and intracellular cytokines in monocytes were measured by flow cytometry. (A) Scatter plots from one representative donor representing the intracellular IL-1β, IL-6 and TNF-α expression in monocytes in response to 1.25 × 10⁶ or 5 × 10⁶ bacterial cells/mL of A. odontolyticus, S. parasanguinis, and S. anginosus or 2 ng/mL of LPS. (B) Median percentages of monocytes expressing IL-1β, IL-6, and TNF-α, and the geometric mean expression of CD14 on monocytes following stimulation with A. odontolyticus, S. parasanguinis, S. Anginosus, and LPS. (C) Histograms from one representative donor showing CD14 expression on monocytes treated with different concentrations of A. odontolyticus, S. parasanguinis, S. Anginosus, or LPS. The y-axis indicates the cell count for each population, and the x-axis shows the anti-CD14-PE-Cy7 fluorescence intensity. Statistical analysis was performed using a paired one-way ANOVA test; * P < 0.05, ** P < 0.01, *** P < 0.001, and **** P < 0.0001. A. odontolyticus, Actinomyces odontolyticus; S. parasanguinis, Streptococcus parasanguinis; S. anginosus, Streptococcus anginosus; LPS, lipopolysaccharide.
