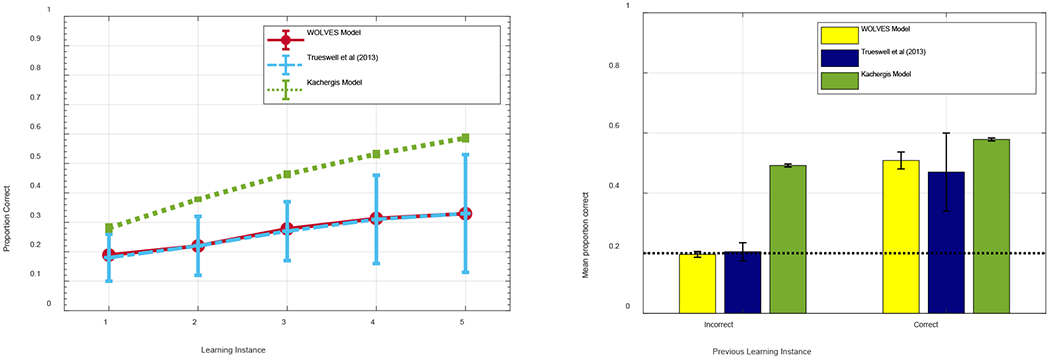
Figure 13:

Average proportion of correct responses by adult participants (left, blue), WOLVES (left, red), and Kachergis model (left, green) as a function of learning instance and (right) as a function of whether the participant/model had been correct or incorrect on the previous learning instance for that word. Error bars indicate ± 95% confidence interval and black, dashed lines indicate the chance level of performance.
