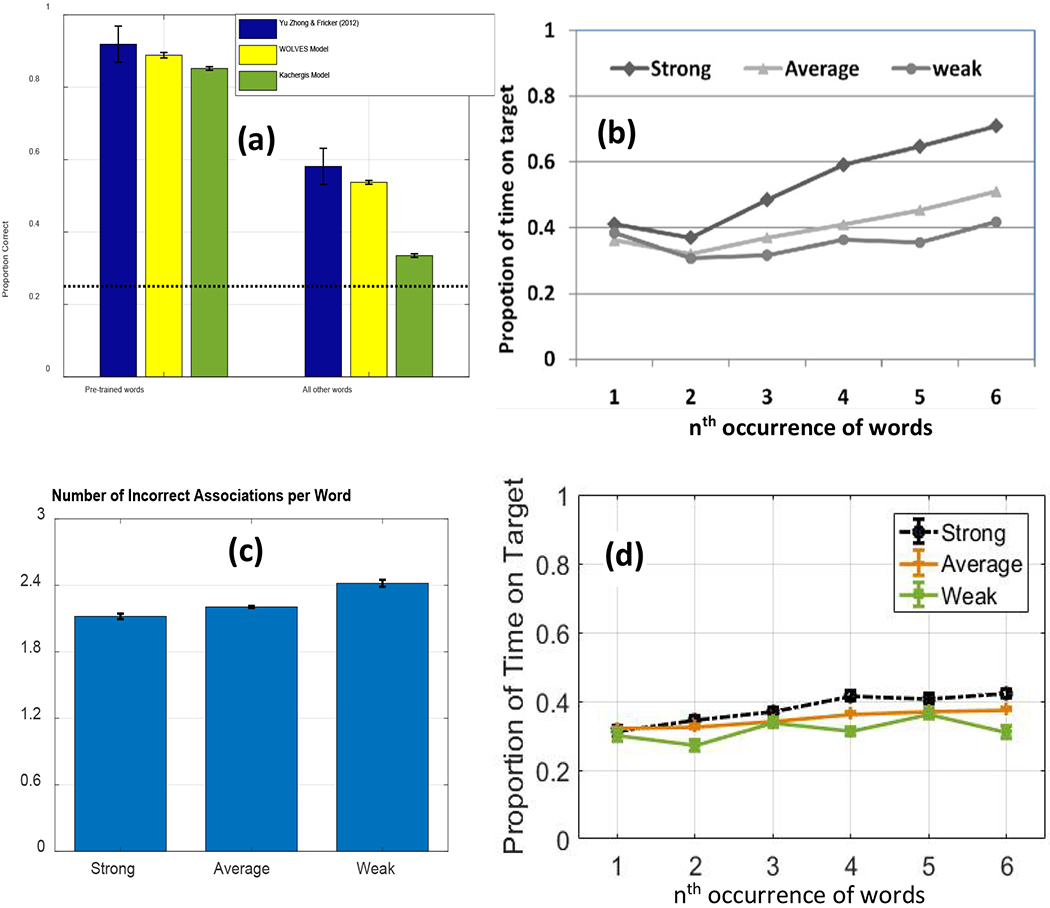
Figure 17.

(a): mean proportion correct responses at test by adults (blue bars), by WOLVES (yellow bars), and by the Kachergis model (green bars) for the three pre-trained words and the other fifteen to-be-learned words. (b & d): Proportion looking time to target after word presentation by adults and (d) the WOLVES model against word occurrence as each word appeared 6 times throughout training. (c): number of incorrect associations per word for the different types of learners. Weak learners have the maximum number of incorrect associations indicating greater uncertainty in their word knowledge.
