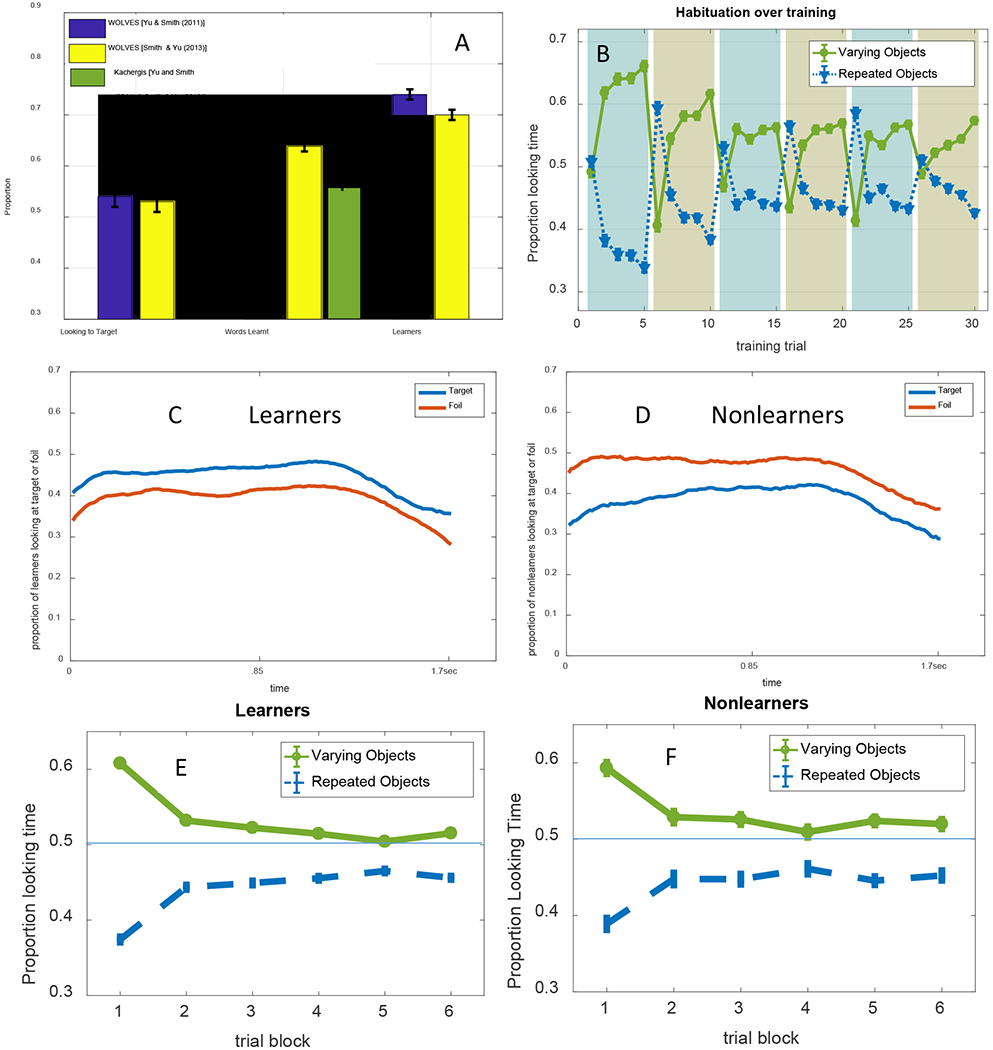
Figure 23:

(a) Comparison of WOLVES learning in Smith & Yu (2013, yellow bars) and Yu & Smith (2011, blue bars) in terms of proportion of time looking to the target (left bars), proportion of words learned (middle bars) and proportion of models classified as learners. Green bar shows identical proportion of words learned for the Kachergis model in both experiments. (b) Proportion looking to varying object versus the repeated objects over the 30 training trials of Smith & Yu (2013). The training trials are split into six blocks shaded with different colours. Looking to the repeating objects (blue line) drops within each training block and jumps up when a new repeating object is presented at the start of each block. (c & d): Proportion looking to target (blue) v. distractor (red) following word presentation at test for WOLVES model runs classified as learners (c) and nonlearners (d). (e & f): Mean proportion of looking (and standard deviations) to the varying and repeated object as a function of block for the learner and nonlearner models.
