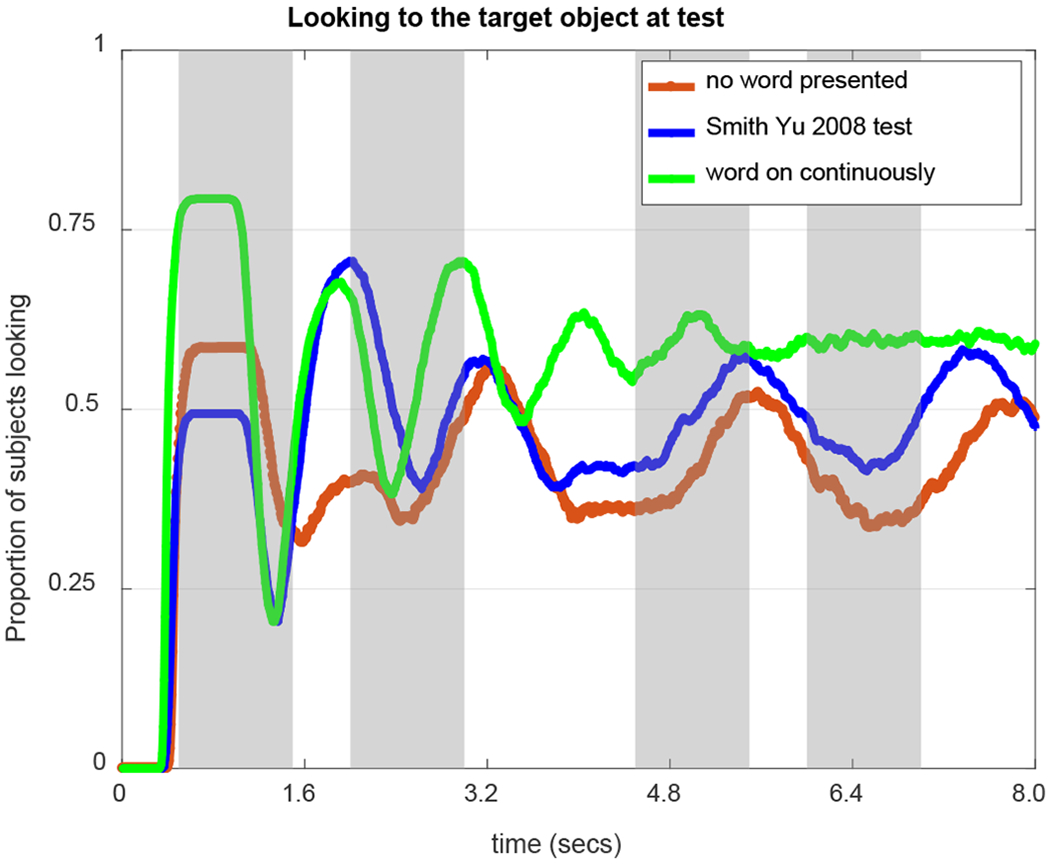
Figure 24:

The time course plot shows the proportion of looking to target for WOLVES over the 8 seconds of the test trial for three different conditions: when no word was presented during the tests (red curve); when the word was presented as per the Smith & Yu (2011) task (blue curve) and when the word was presented for the full duration of the test (green curve). The grey rectangular columns specify time windows during which word was presented according to the Smith & Yu (2011) test paradigm.
