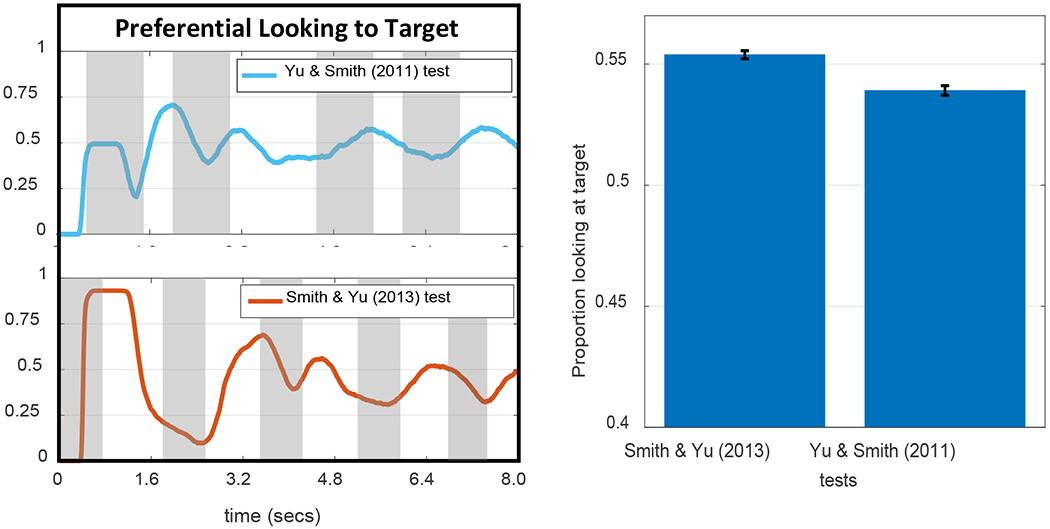
Figure 25:

(Left panel) Time course plots showing proportion of looking to target for WOLVES over the 8 seconds of the test trial using test formats of Yu & Smith (2011) task (blue curve) and that of Smith & Yu (2013) task (red curve). The grey rectangular columns specify time windows during which word was presented in each test paradigm. (Right panel): Average proportion looking to target in the two test paradigms.
