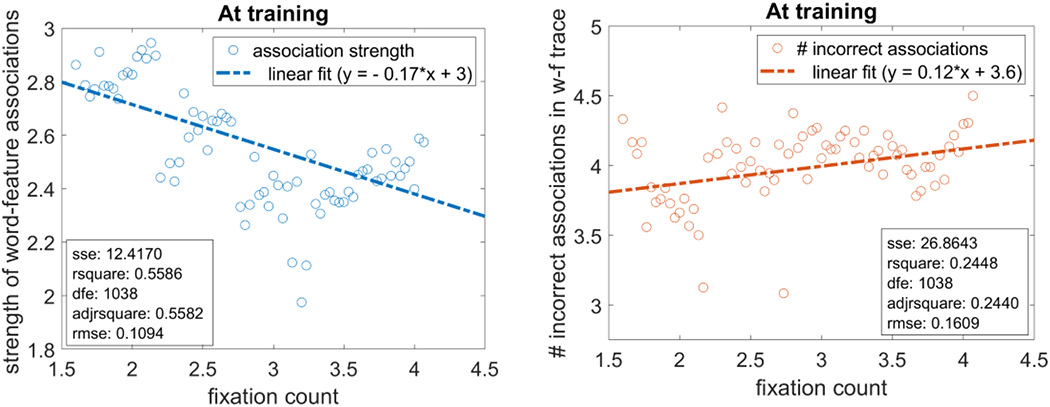
Figure 7.

Left: Relation between the number of fixations a model makes during a training trial and the average strength of the word-feature associations formed by the model. The blue line shows a linear fit of the data with an RMSE=0.11. Right: Growth of the average number of erroneous associations formed with increasing fixations at training. The red line shows a linear fit of the data with an RMSE=0.16. Other statistical measures are indicated in both plots. Note that each value plotted on the Y-axis is averaged (after binning) over models within a bin-width of 0.03 in fixation counts.
