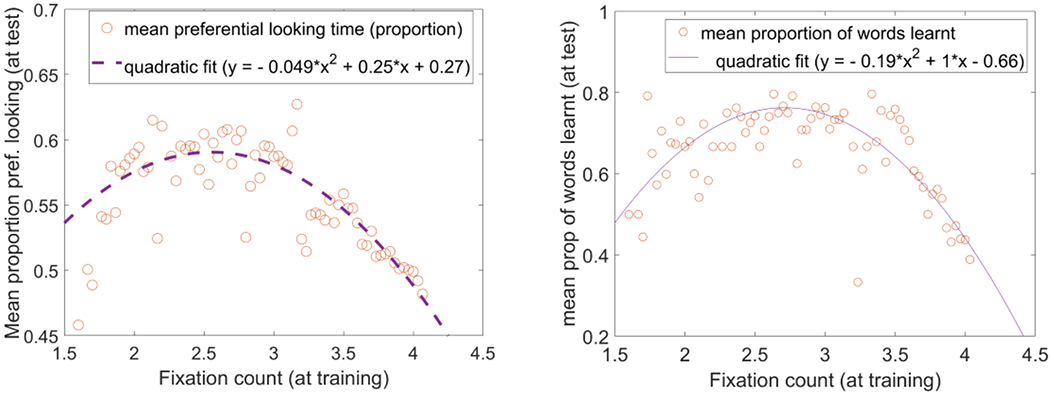
Figure 8:

Relation between mean proportion of preferential looking to the target at test (left panel), mean proportion of words learned (right panel), and the number of fixations during training. Note that each value plotted on Y-axes is averaged (after binning) over models within a bin-width of 0.03 in fixation counts.
