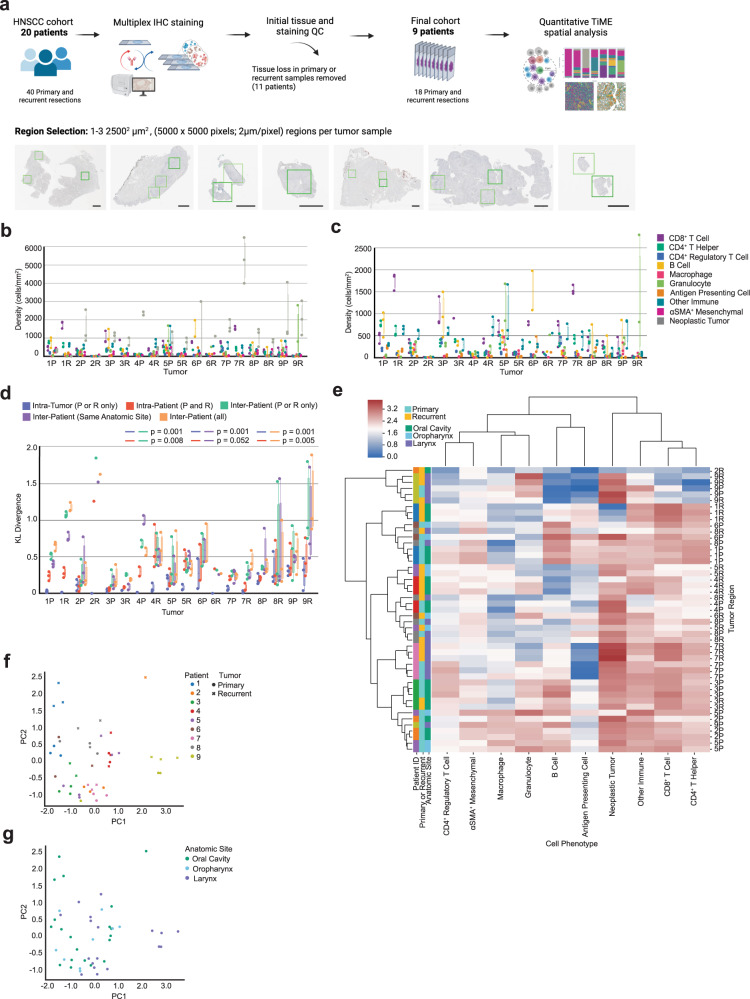
Fig. 1. Heterogeneity across patients and tumor regions.
a Cohort and tissue region selection overview. One to three regions of 25002 µm2 were assayed with mIHC per eighteen tumor resections and are represented by the green boxes in the tissue images. Black scale bar = 2500 µm. b Density (cells/mm2) of each cell type present per individual primary (P) and recurrent (R) tumor. Each dot represents a single tumor region (n = 47). c Density (cells/mm2) of each immune cell type present per individual primary (P) and recurrent (R) tumor. Each dot represents a single tumor region (n = 47). d Box plot of the Kullback–Leibler divergences from a single tumor region’s cellular distribution compared to: the tumor’s average cellular distribution [Intra-Tumor (P or R only)], the patient’s average cellular distribution [Intra-Patient (P and R)], the cohort’s average cellular distribution across tumors of the same timepoint [Inter-Patient (P or R only)], the cohort’s average cellular distribution across tumors of the same anatomic site [Inter-Patient (Same Anatomic Site)], the cohort’s average cellular distribution across all tumors from all patients [Inter-Patient (all)]. P-values calculated using a one-way ANOVA multi-group significance test followed by a Tukey honestly significant difference post-hoc test. e Heatmap of cellular composition across tumor regions. Rows are individual tumor regions that are ordered by the hierarchical clustering of their cellular composition. Columns are the cell types used as clustering features. Composition was normalized using a log10 + 1 transformation before clustering. Leftmost three columns are color coded by patient, tumor timepoint, and anatomic site. f Principal component analysis on cellular density following a log10 + 1 transformation. Each point (n = 47) represents one tumor region and is colored by patient. The shape of each point denotes primary or recurrent status. g Principal component analysis on cellular density following a log10 + 1 transformation. Each dot (n = 47) represents one tumor region and is colored by anatomic resection site.

