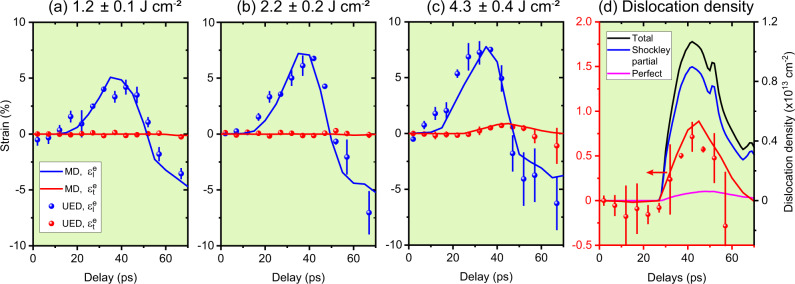
Fig. 3. Strain evolution of (110) single-crystal Al under laser-driven compression obtained from UED experiments (filled circles) and MD simulations (lines).
a–c are the results at incident laser fluences of 1.2, 2.2, and 4.3 J cm−2, respectively. denotes the longitudinal elastic strain; denotes the transverse elastic strain. The error bars represent 1 standard deviation uncertainties. The measured evolution of shown in (c) is recast in (d), along with the evolution of total, Shockley partial and perfect dislocation densities obtained from MD simulation performed at the same experimental conditions.

