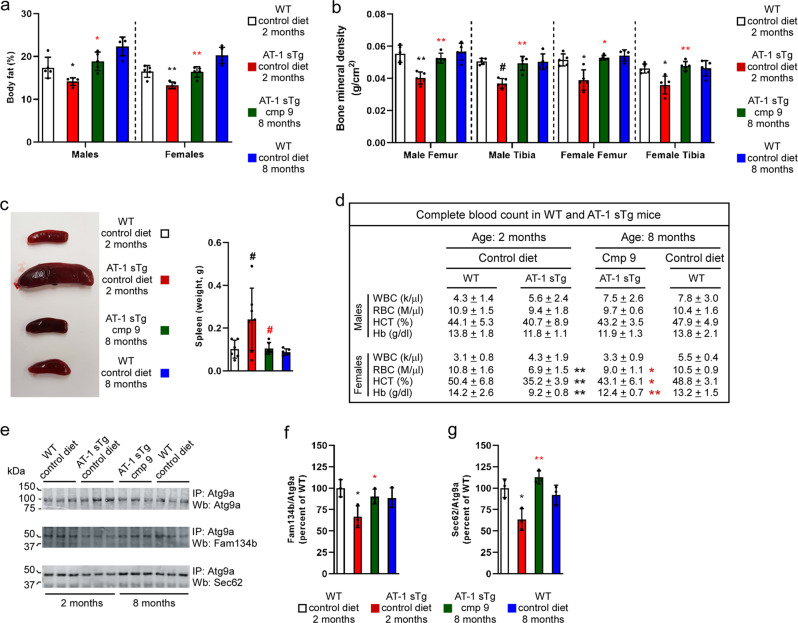
Fig. 2. Late treatment with Compound 9 rescues the AT-1 sTg phenotype.
a Quantification of body fat. b Quantification of bone mineral density. c Representative image of spleens (left panel) and quantification (right panel). d Hematologic parameters of WT mice and AT-1 sTg mice (WT (2 month), n = 5; WT (8 month), n = 5; AT-1 sTg (control diet), n = 5; AT-1 sTg (cmp 9), n = 5). e–g Western blot showing co‐immunoprecipitation of Atg9a, Fam134b, and Sec62 in WT and AT‐1 sTg mice. Representative blots are shown in (e) while quantitation of results is shown in (f, g). Bars represent mean ± SD. *p < 0.05, **p < 0.005, #p < 0.0005 via ordinary two-way ANOVA with Tukey’s multiple comparison test. Black symbol, significance vs WT; Red symbol, significance vs untreated/control diet AT-1 sTg. WBC white blood cells; RBC red blood cells; HCT hematocrit; Hb hemoglobin.

