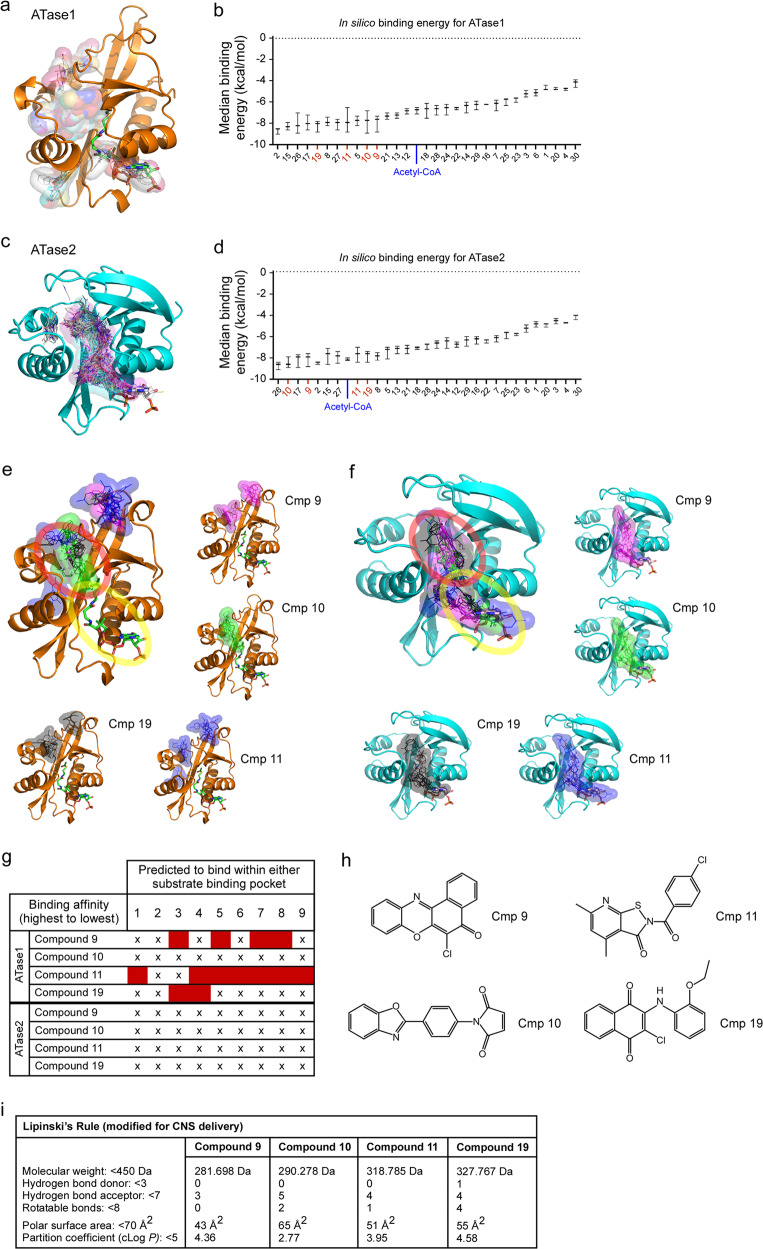
Fig. 3. Identification of ATase inhibitors through in silico binding.
Representative images (a and c) and median binding energy (b and d) of potential ATase inhibitors that are docked in silico to ATase1 (a, b) or ATase2 (c, d). Representative images of Compound 9, 10, 11, and 19 bound in silico to ATase1 (e) or ATase2 (f). The top 8 binding affinity placements are shown for each compound. The peptidyl-Lys binding pocket is circled in red while the acetyl-CoA binding pocket is circled in yellow. g Prediction of binding within substrate pockets for ATase1 and ATase2. Top 8 binding affinity placements are listed for each compound. Binding affinity placement within either the peptidyl-Lys or the acetyl-CoA pocket is marked with an (X); binding affinity placement outside of either pocket is marked by a red box. h Structures of Compound 9, 10, 11, and 19. i Modified Lipinski’s Rule for CNS delivery of Compound 9, 10, 11, and 19.

