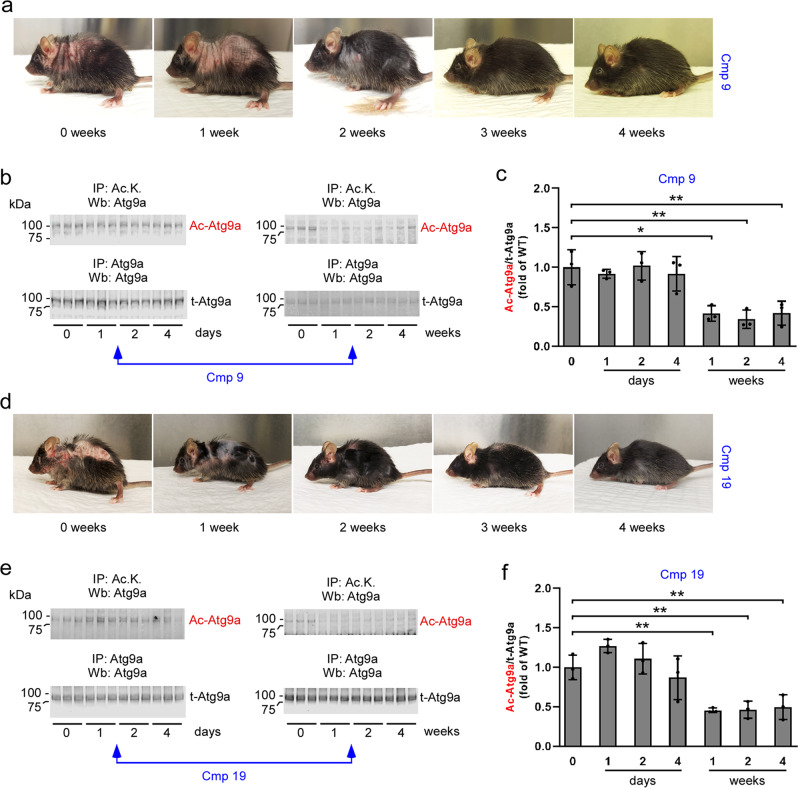
Fig. 6. Target engagement of Compound 9 and Compound 19 in AT-1 sTg mice.
a Representative images to document rescue of the phenotype following Compound 9 treatment. The same AT-1 sTg mouse is shown. b and c Western blot showing levels of acetylated-Atg9a (Ac-Atg9a) in ER preparations from liver. Representative blots are shown in (b) while quantitation of results is shown in (c). d Representative images to document rescue of the phenotype following Compound 19 treatment. The same AT-1 sTg mouse is shown. e and f Western blot showing levels of acetylated-Atg9a (Ac-Atg9a) in ER preparations from liver. Representative blots are shown in (e) while quantitation of results is shown in (f). Bars represent mean ± SD. *p < 0.05, **p < 0.005, ***p < 0.0005, #p < 0.0001 via ordinary two-way ANOVA plaque area percentage with Tukey’s multiple comparison test. Treatment started at 2-months of age.

