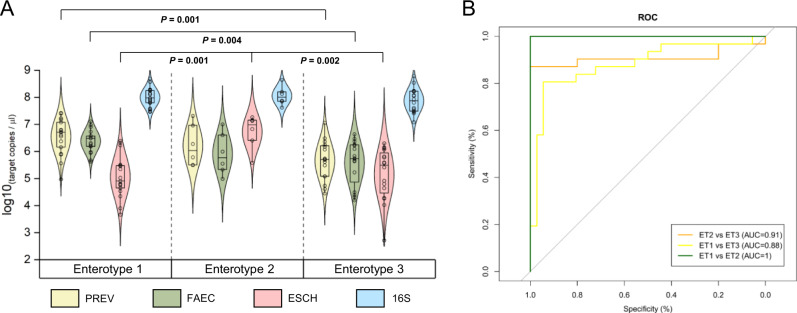
Fig. 3. Taxon-specific and total bacterial qPCR to classify pre-treatment sample in a treatment-relevant category.
A Total bacteria and taxon-specific density measured by quantitative PCR (qPCR), by enterotype. Comparison of absolute abundances between enterotype 1 (n = 17), enterotype 2 (n = 6), and enterotype 3 (n = 16) was conducted using two-sided Mann-Whitney tests. The lower and upper bound of each box represent the 25th and 75th percentiles, respectively, and the line within indicates the median. The whiskers represent the minimum and maximum values. B Classification sensitivity and specificity into the enterotype using qPCR values. PREV Prevotella genus qPCR target, FAEC Faecalibacterium genus qPCR target, ESCH Escherichia coli qPCR target; 16S total bacteria qPCR target.

