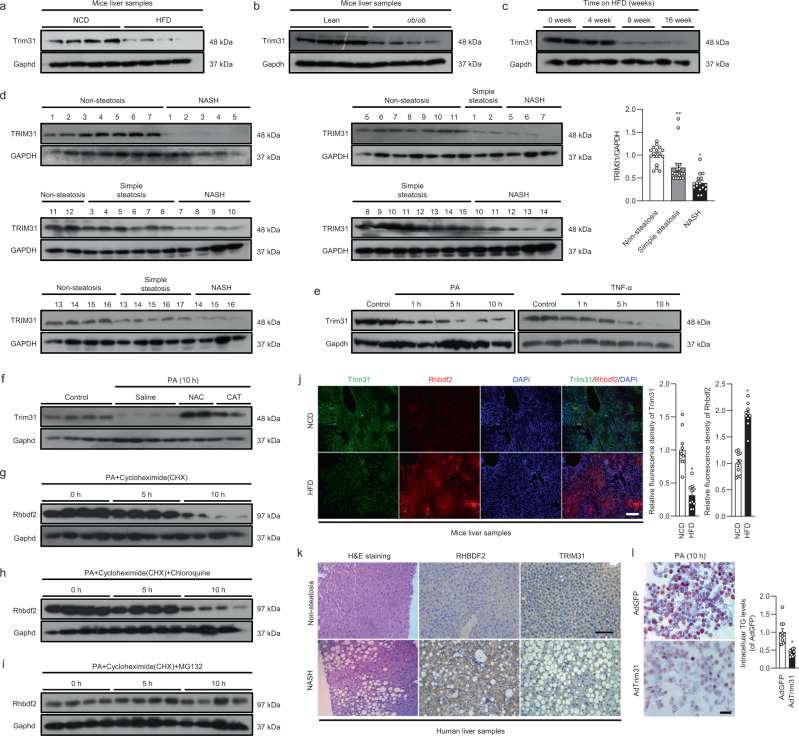
Fig. 1. Trim31 expression is restrained in the livers with hepatic steatosis.
a, b Representative immunoblotting bands of Trim31 expression in the liver samples isolated from C57BL/6 N mice that were treated with a NCD or HFD for uninterrupted 16 weeks (a) or from ob/ob or lean mice (b) (n = 4 per experiment). c Representative immunoblotting bands of Trim31 expression in the liver samples isolated from C57BL/6N mice that were treated with a HFD over time (n = 4 per experiment). d Representative immunoblotting bands and relative expression levels of TRIM31 in the liver samples of donors with non-steatosis (n = 16 samples), simple steatosis (n = 17 samples) or NASH (n = 16 samples) phenotype (**P < 0.01 vs. non-steatosis groups, *P < 0.05 vs. simple steatosis groups). e–i Representative immunoblotting bands of Trim31 or Rhbdf2 expression in cultured primary hepatocytes that were incubated with 400 μM palmitate (PA) or 100 ng/ml TNF-α (e), respectively; with PA in combination with 10 μM N-acetyl-L-cysteine (NAC) or 400 U/ml catalase (CAT) (f); or with PA and protein synthesis inhibitor cycloheximide (CHX) (g) in combination with 20 μM chloroquine (h) or 10 μM MG132 (i). The BSA or saline was treated as controls (n = 4 per experiment). (j) Representative immunofluorescence images of Trim31 and Rhbdf2 co-expression in mice liver tissue isolated from C57BL/6 N mice that were treated with a NCD or HFD for 16 weeks (magnification, ×40; n = 10 images per group for each staining) (*P < 0.01 vs. NCD group). k Representative images of hematoxylin–eosin (H&E)-stained pathological section, and immunohistochemical staining of TRIM31 or RHBDF2 expression in patients with NASH (magnification, ×100; n = 12 images per group for each staining). l Intracellular triglyceride (TG) analysis with the Oil-red O staining of adenovirus-loading full-length Trim31 sequences (AdTrim31)-transfected L02 cells under PA treatment for 10 h. The adenovirus-containing GFP vector (AdGFP) was used as controls (magnification, ×100; n = 10 images per group for each staining) (*P < 0.01 vs. AdGFP group). Data are expressed as mean ± SEM. The relevant experiments presented in this part were performed independently at least three times. Significance determined by one-way analysis of variance (ANOVA) followed by Dunnett’s multiple comparisons test (d) and Student’s two-tailed t test analysis (j, l).

