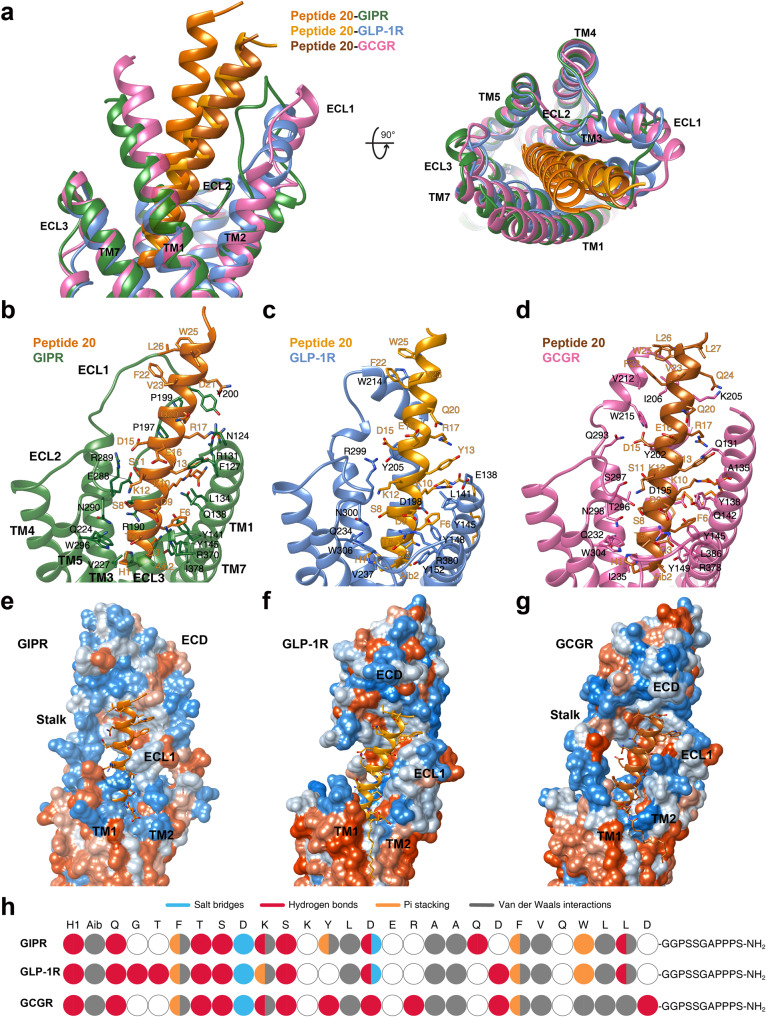
Fig. 4. Molecular recognition of peptide 20 by GIPR, GLP-1R and GCGR.
a Structural comparison of peptide 20–GIPR–Gs, peptide 20–GLP-1R–Gs and peptide 20–GCGR–Gs. Receptor ECD and G protein are omitted for clarity. b–d Interactions between peptide 20 and the TMDs of GIPR (forest green), GLP-1R (blue), and GCGR (hot pink). Residues involved in interactions are shown as sticks. e–g Surface representations of the receptor for each of the peptide-receptor complex, with the peptides shown as ribbon and sticks. The receptor is shown in surface representation and colored from dodger blue for the most hydrophilic region, to white, to orange red for the most hydrophobic region. h The peptide recognition modes are described by fingerprint strings encoding different interaction types of the surrounding residues in each receptor. Color codes are listed on the top panel. Residues that show no interaction with receptors are displayed as white circles.

