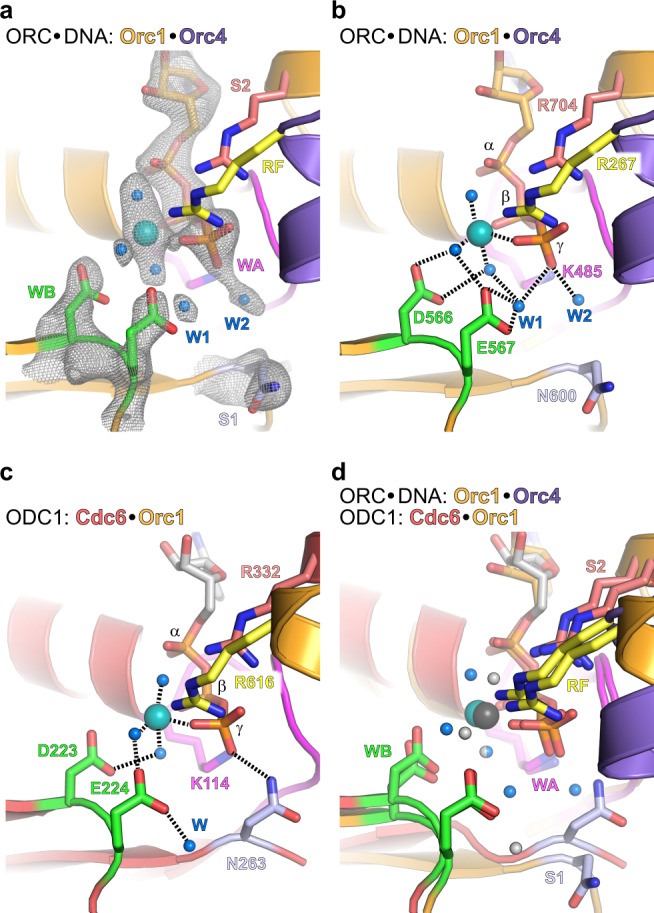
Fig. 2. The ATPase sites reside in a pre-hydrolysis state.

a and b Configuration of the Orc1·Orc4 ATPase site in DNA-bound ScORC. The density-modified cryo-EM map is shown as gray mesh for ATP, Mg2+, waters, and Walker B and sensor 1 side chains in a. c Configuration of the Cdc6·Orc1 ATPase site in ODC1. Dashed lines in b and c summarize bonding interactions of water molecules and sensor 1. Superposition of the Orc1·Orc4 and Cdc6·Orc1 ATPase sites of ScORC·DNA and ScORC·DNA·Cdc6, respectively, highlights the different conformations of the sensor 1 residues. Magnesium and waters are shown in teal and blue, respectively; an exception is the Orc1·Cdc6 site in (d), where the corresponding elements are colored gray. See also Supplementary Fig. 6. WA – Walker A, WB – Walker B, S1 – sensor 1, S2 – sensor 2, RF – arginine finger, W - water.
