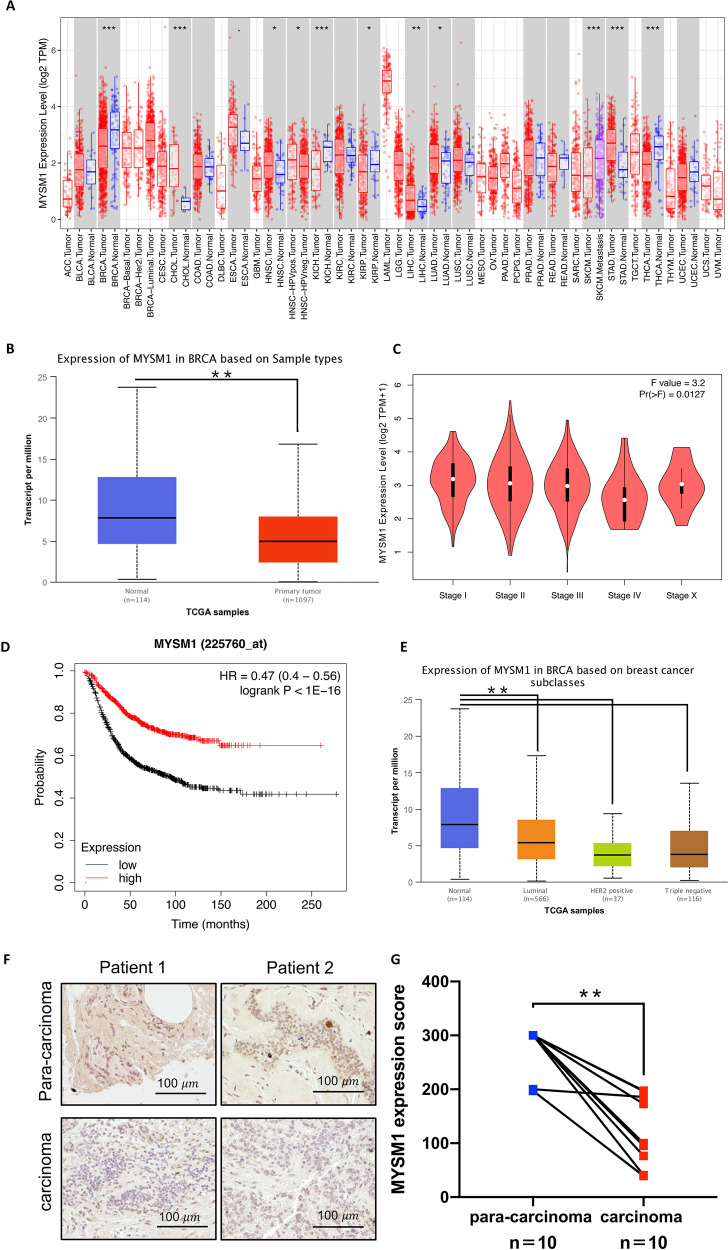
Fig. 1. Low expression of MYSM1 is correlated with a poor progression in breast cancer.
A MYSM1 expression levels in different types of cancers. The statistical significance was determined via the Wilcoxon test (annotated by *P < 0.05; **P < 0.01; ***P < 0.001). Data were acquired from the TCGA database and analyzed using TIMER bioinformatics. B MYSM1 mRNA levels in breast normal tissues and primary breast tumor tissues; data were acquired from the TCGA database and analyzed via UALCAN bioinformatics. C One-way ANOVA was used to analyze MYSM1 expressions based on the primary pathological stage as a variable. Data were acquired from the TCGA databases and analyzed via GEPIA bioinformatics. D The relapse-free survival curve of groups of patients with high and low levels of MYSM1. Data were acquired from the Kaplan–Meier plotter. E MYSM1 levels in breast cancer subclasses based on the TCGA database and analyzed via UALCAN bioinformatics. F The representative immunohistochemical images of MYSM1 protein levels in carcinoma and para-carcinoma tissues of patients with TNBC. Scale bars: 100 μm. G Quantification of MYSM1 expression in carcinoma and para-carcinoma tissues of patients with TNBC using the Image-Pro Plus software. *P < 0.05 and **P < 0.01.

