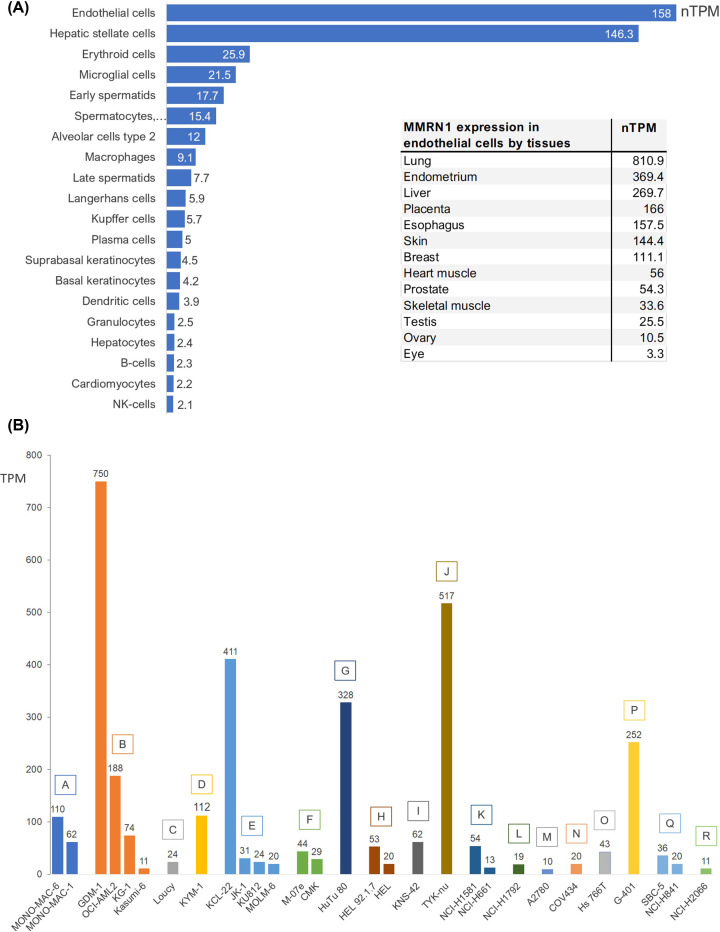
Figure 4. Expression of MMRN1 in cell types and cancer cell lines.
(A) The data show the expression of MMRN1 (nTPM > 2.0) in different healthy cell types. The expression data for these graphs were obtained from the Human Protein Atlas (https://www.proteinatlas.org/ENSG00000138722-MMRN1/single+cell+type) [85]. The inset shows the expression of MMRN1 in epithelial cells in specific organs/tissues. (B) Expression (TPM) of MMRN1 in various cancer cell lines representing adult acute monocytic leukaemia (A), adult acute myeloid leukaemia (B), adult T acute lymphoblastic leukaemia (C), alveolar rhabdomyosarcoma (D), blast phase chronic myelogenous leukaemia (BCR-ABL1 positive, E), childhood acute megakaryoblastic leukaemia (F), duodenal adenocarcinoma (G), erythroleukemia (H), glioblastoma (I), high-grade ovarian serous adenocarcinoma (J), large cell lung carcinoma (K), lung adenocarcinoma (L), ovarian endometrioid adenocarcinoma (M), ovarian granulosa cell tumour (N), pancreatic adenocarcinoma (O), rhabdoid tumour of the kidney (P), small cell lung carcinoma (Q), squamous cell lung carcinoma (R). The expression data were obtained from experiment E-MTAB-2770, EMBL-EBI Expression Atlas (Human Protein Atlas proteinatlas.org, [85]).

