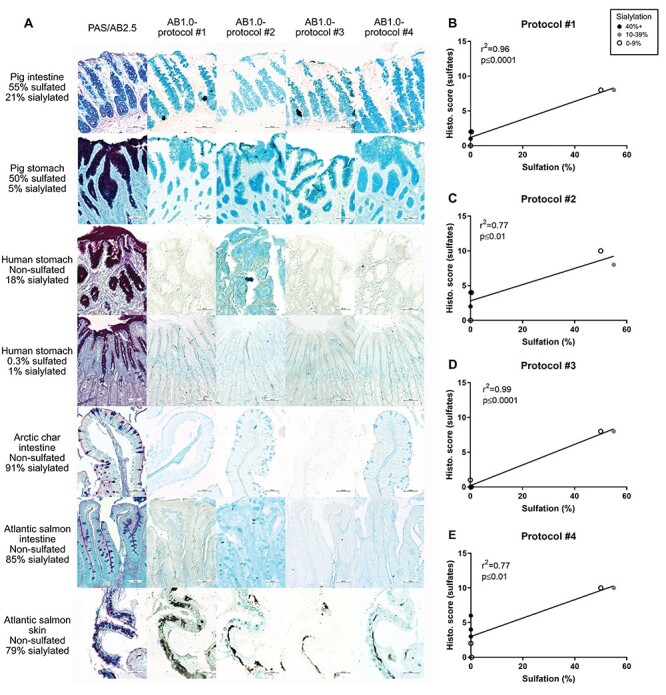
Fig. 1.

PAS/AB2.5 and four varieties of AB1.0 staining to visualize sulfation in animal tissues and correlation with relative abundance of sulfate. (A) Tissues with decreasing levels of sulfation (quantified by MS), from top to bottom, were stained. PAS/AB2.5 shows neutral mucins with magenta color and acidic mucins with blue color. The black in the Atlantic salmon skin samples is an artifact present in skin with this stain, but goblet cells can be observed in areas without black. 100× magnification. (B–E) Sulfate levels of the seven tissues studied correlated positively with all four protocols. Protocol #3 (D) shows the strongest association between the parameters (r2 = 0.99, P ≤ 0.0001, n = 7), followed by protocol #1 (B) (r2 = 0.96, P ≤ 0.01, n = 7), protocol #4 (E) (r2 = 0.77, P ≤ 0.01, n = 7) and protocol #2 (C) (r2 = 0.77, P ≤ 0.01, n = 7). Samples having high relative abundance of sialic acids (black dots) cause elevated staining levels with protocols #1, #2 and #4 but not with #3. Sialic acid abundance is marked with black dots over 40%, gray dots between 10% and 39% and white dots at or below 9%. Statistics: Pearson’s correlation test (r2, n = 7).
