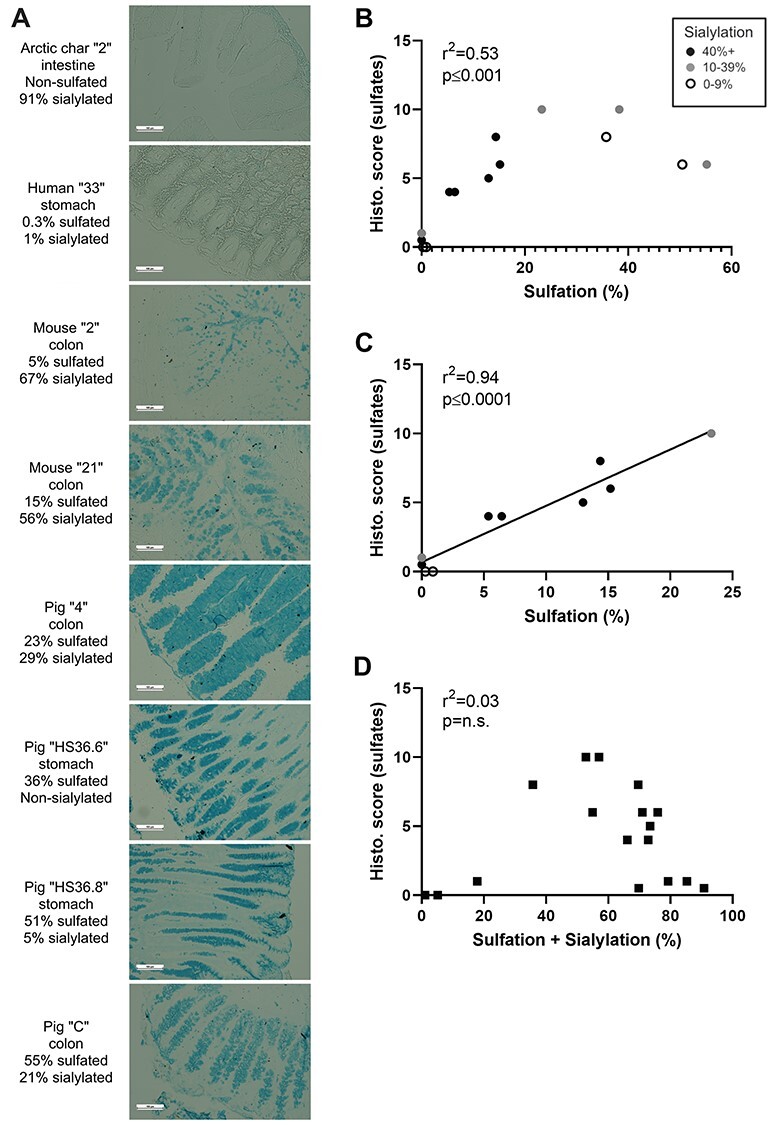
Fig. 2.

Relationship between MS quantification versus staining with “protocol #3” for sulfates. (A) Eight representative tissues with increasing levels of sulfation (quantified by MS) from top to bottom were stained with “protocol #3.” Arctic char: There is weak staining in the nonmucosal region and no apparent staining in the mucosal region. Human stomach: There is no visible staining of the tissue. Murine colons: There is moderate staining in both the 5% sulfated and the 15% sulfated mucus in the goblet cells and the in the luminal space. Pig tissues: All pig tissues stained strong for sulfates. Out of the four tissues, the stomach samples (36% and 51% sulfated) show slightly stronger staining than the colon sections (23% and 55% sulfated). 100× magnification. (B) Correlation analysis showed positive correlation between the two quantification methods (r2 = 0.73, P ≤ 0.001, n = 17), however, the linear relationship disappeared at sulfation values >24%. (C) There is a strong correlation between histological staining and MS quantification for samples with low-to-moderate sulfation (<25% abundance; r2 = 0.97, P ≤ 0.0001, n = 13). On graphs (B) and (C), the samples with high sialic acid content (black dots) have histological scores in line with the samples with low sialic acid content (white dots). (D) The staining scores of “protocol #3” did not correlate with the total abundance of sialic acids and sulfates in the samples (r2 = 0.03, P = n.s., n = 17). Sialic acid abundance is marked with black dots over 40%, gray dots between 10% and 39% and white dots at or below 9%. Statistics: Pearson’s correlation test (r2).
