
Fig. 6.
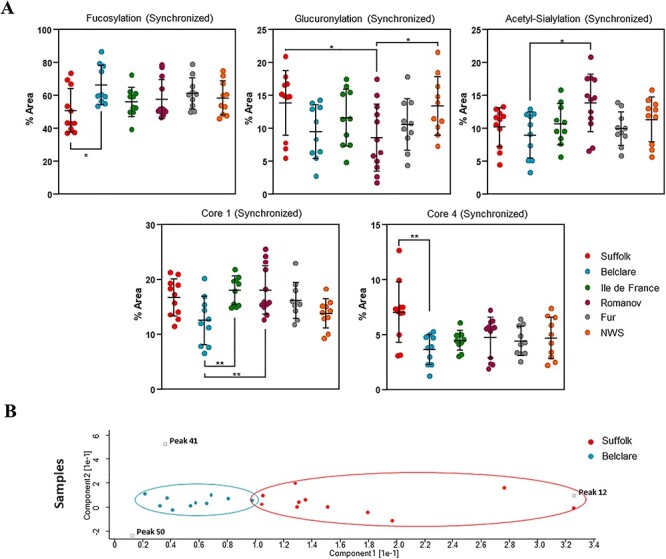
(A) Nested plots of significant feature changes (fucosylation, glucuronylation, Neu5Ac, core 1 and core 4) in cervical mucus of six European ewe breeds at the follicular phase of a synchronized cycle. *P < 0.05, **P < 0.01, ***P < 0.001. (B) PCA plot shows the three core 4-associated peaks (12, 41 and 50), which are driving the significant difference between Suffolk and Belclare (samples within each breed are indicated by the same colors).