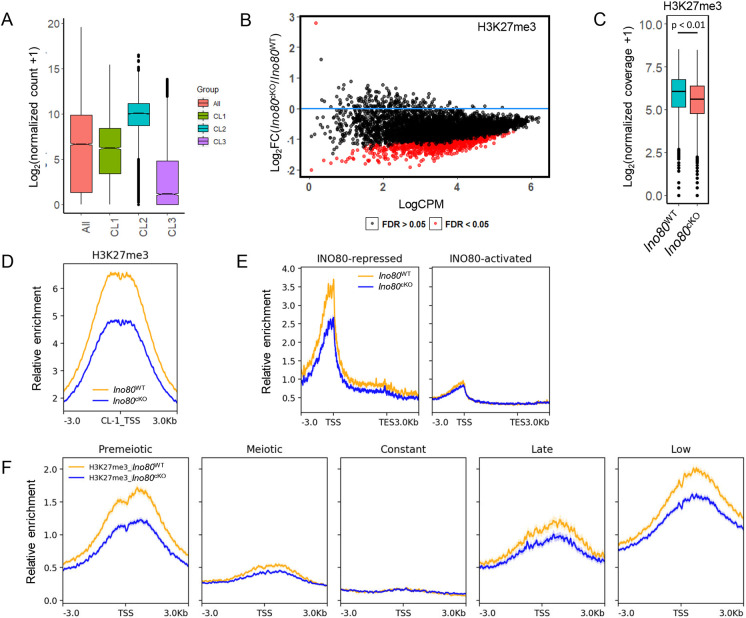
Fig. 3.
INO80 regulates establishment of histone H3 lysine 27 trimethylation. (A) The average gene expression level of all expressed genes and genes that belong to each of the three gene clusters in Ino80WT, based on the presence of either H3K4me3 or bivalent marks along with INO80. Lower and upper limits of the box represent first and third quartiles, midline represents the median, whiskers denote lower and upper limit of the dataset, and black dots represent outliers. (B) Differential analysis of H3K27me3 binding at bivalent domains (CL1) bound to INO80. Red dots represent promoters that have a significant (FDR<0.05) change in H3K27me3 enrichment in Ino80cKO compared with Ino80WT. Black dots represent FDR>0.05. FDR was derived by the Benjamini–Hochberg method (n=3). (C) Comparison of normalized coverage for H3K27me3 between Ino80cKO and Ino80WT at bivalent INO80-interacting regions (CL1). P<0.01, as calculated by Wilcoxon signed rank test (two-tailed). Lower and upper limits of the box represent first and third quartiles, midline represents the median, whiskers denote lower and upper limit of the dataset, and black dots represent outliers. (D) Metaplots showing relative enrichment for H3K27me3 between Ino80cKO and Ino80WT for CL1. Yellow, Ino80WT; blue, Ino80cKO. Plots are centered at the TSS. (E) Metaplots showing relative enrichment of H3K27me3 between Ino80cKO and Ino80WT 3 kb upstream and downstream of the promoter and gene body (represented as a 5 kb region) for either INO80-repressed or INO80-activated genes in Ino80WT. Yellow, Ino80WT; blue, Ino80cKO. (F) Relative enrichment of H3K27me3 between Ino80cKO and Ino80WT in each of the five temporal gene expression cohorts. Plots are centered at the TSS. Yellow, Ino80WT; blue, Ino80cKO.

