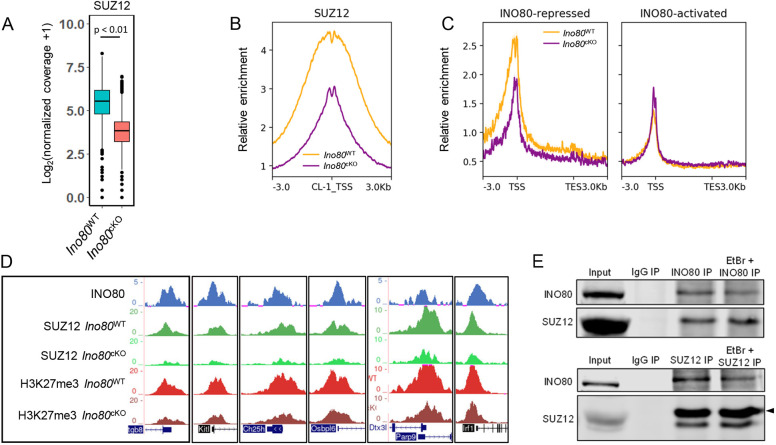
Fig. 4.
INO80 promotes SUZ12-chromatin interaction. (A) Comparison of normalized coverage for SUZ12 between Ino80cKO and Ino80WT at bivalent INO80-interacting regions. P<0.01, as calculated by Wilcoxon signed rank test (two-tailed). Lower and upper limits of the box represent first and third quartiles, midline represents the median, whiskers denote lower and upper limit of the dataset, and black dots represent outliers. (B) Metaplot showing relative enrichment for SUZ12 between Ino80cKO and Ino80WT at CL1. Yellow, Ino80WT; purple, Ino80cKO. (C) Metaplots showing relative enrichment of SUZ12 between Ino80cKO and Ino80WT 3 kb upstream and downstream of the promoter and gene body (represented as 5 kb regions) in either INO80-repressed or INO80-activated genes in Ino80WT. Yellow, Ino80WT; purple, Ino80cKO. (D) Genomic tracks showing comparative enrichment of SUZ12 and H3K27me3 at representative genes. (E) Immunoblot showing the presence of SUZ12 in INO80 immunoprecipitated Ino80WT spermatocyte homogenate (top) and the presence of INO80 in SUZ12 immunoprecipitated Ino80WT spermatocyte homogenate (bottom), in either the presence or absence of ethidium bromide (EtBr). Arrowhead indicates the SUZ12 band in the bottom panel.

