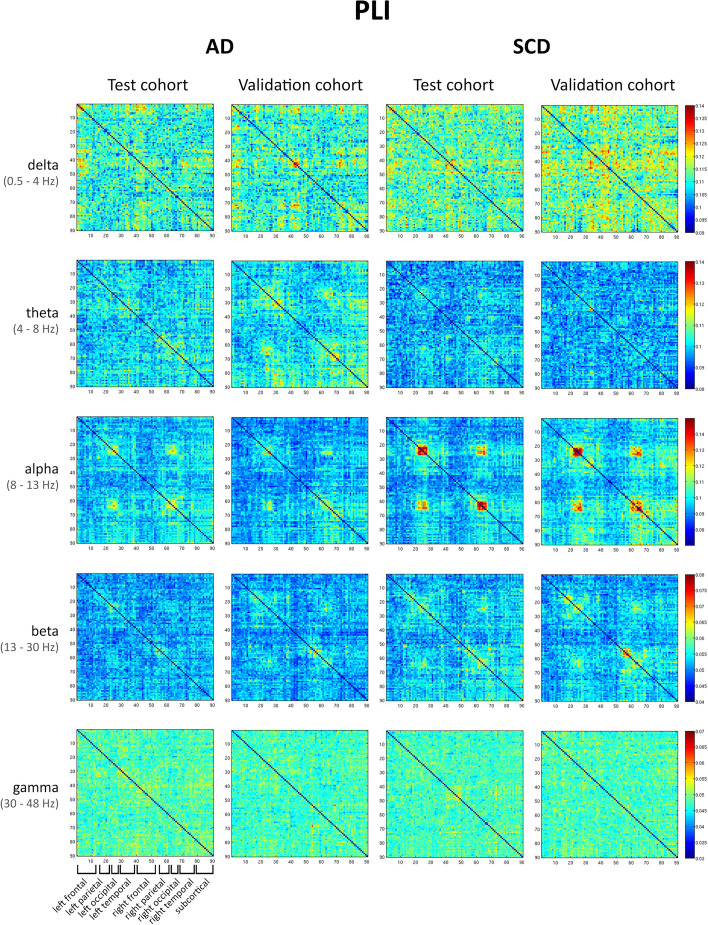
Fig. 5.
Connectivity matrices PLI. Connectivity matrices averaged across all epochs and subjects. Each row represents a different frequency band (delta, theta, alpha, beta, and gamma), and each column shows the results for the PLI, for the test and validation cohorts in the AD and SCD groups. Note that in this figure, the scale is different for each band but the same across the groups. The ROIs are obtained from the AAL atlas, ordered from the left to the right hemisphere, see Fig. 4 and Table S1 for a more detailed description. See also Fig. S4 for the same results displayed using the same colour scale

