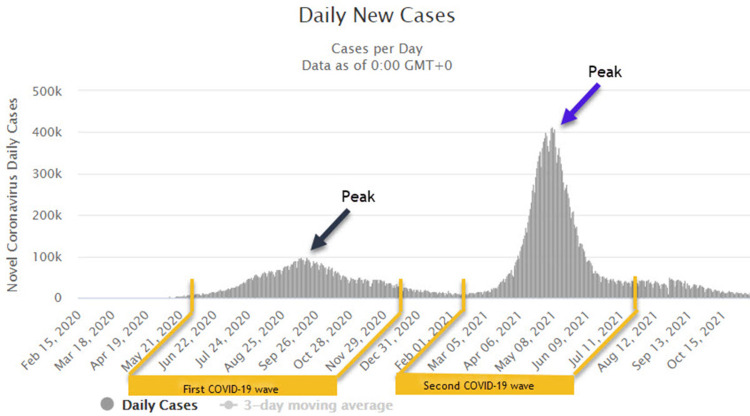
Figure 1. Average number of daily cases (above) between January 2020 and October 2021.
The duration with the maximum caseload and peak of infection was selected for comparison. In the case of India, as the graph depicts, this period was between June and November 2020 for the first COVID-19 wave and March and July 2021 for the second COVID-19 wave. Data from worldometer.com was accessed on November 11, 2021.
COVID-19: coronavirus disease 2019

