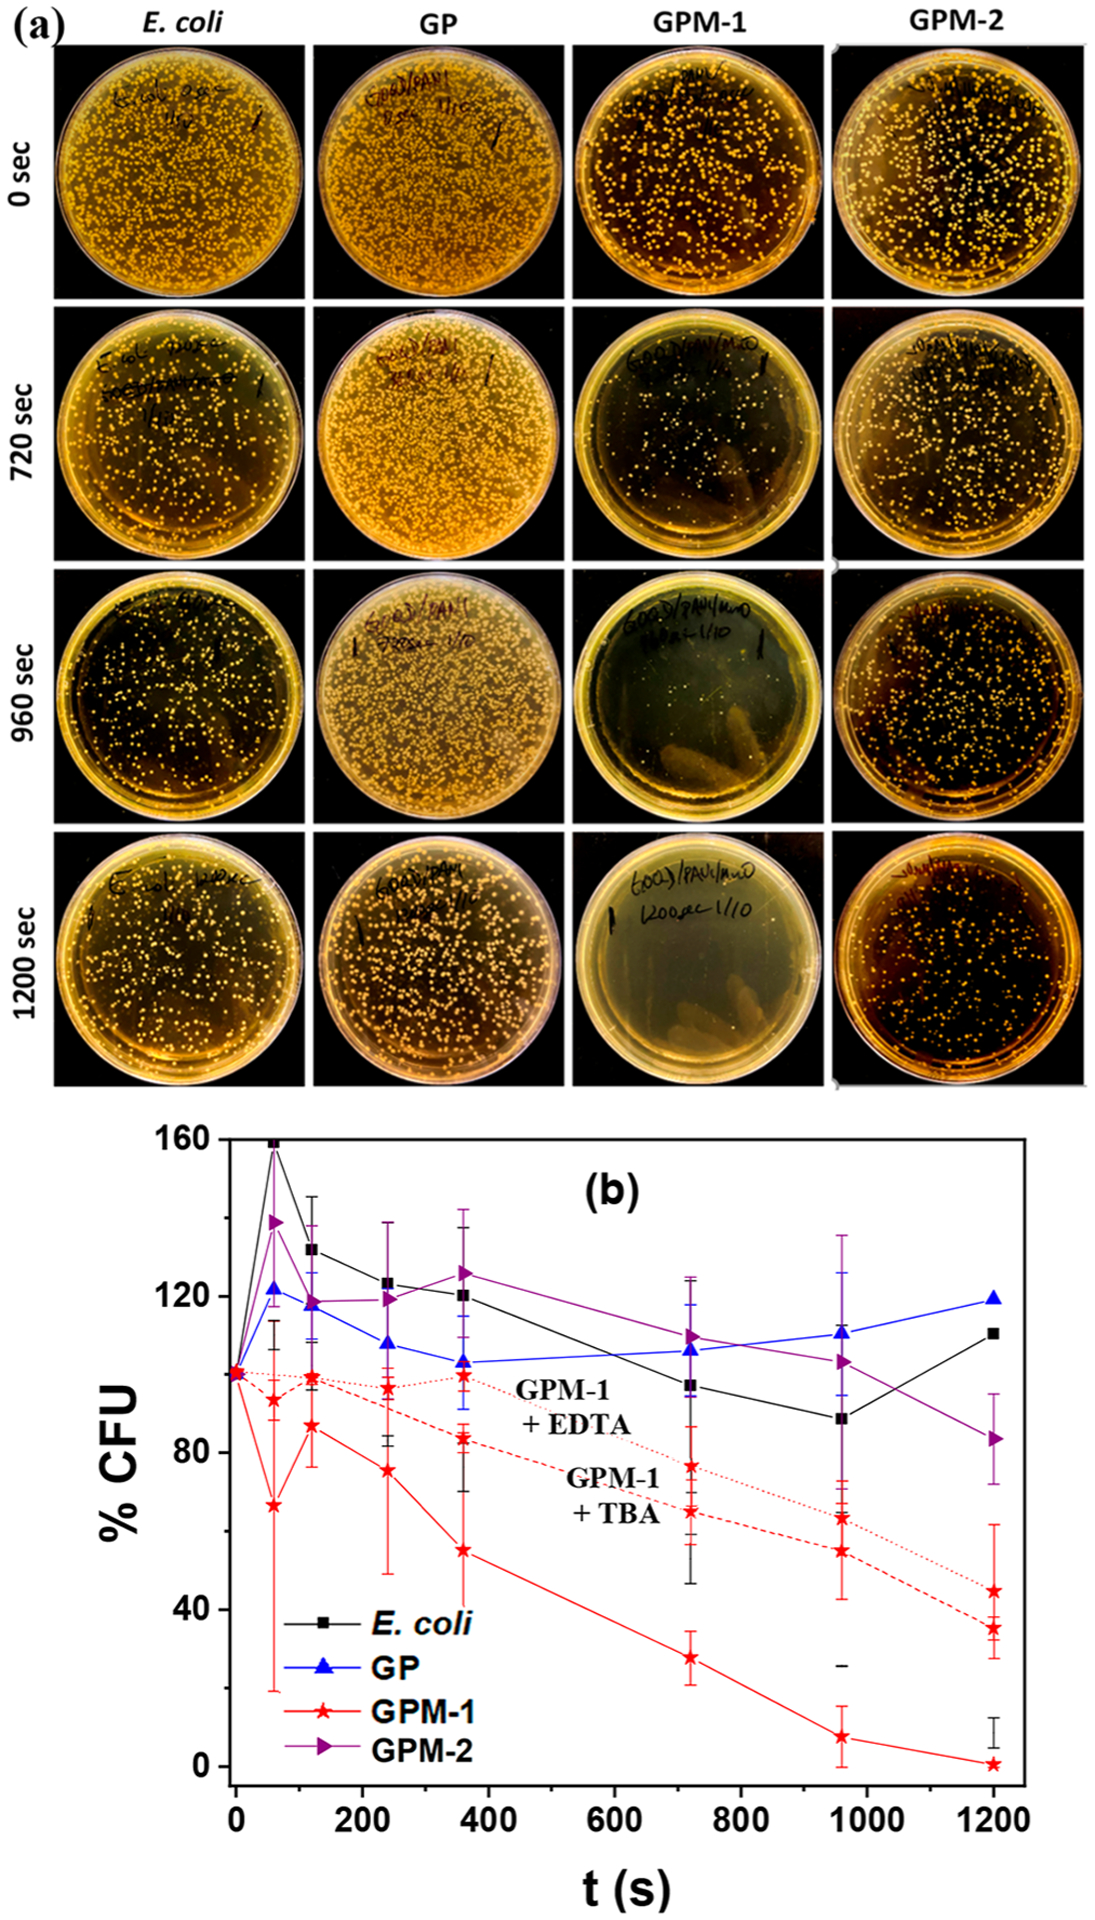
Figure 4.

(a) Photographs of LB agar plates after incubation with E. coli cell suspensions under photoirradiation at 365 nm for varied periods of time in the absence and presence of GP, GPM-1, and GPM-2 at a concentration of 60 μg mL−1. (b) Variation of normalized bacteria colony formation units with photoirradiation time from (a), and the corresponding plots in the presence of GPM-1 along with TBA (red dashed curve) and EDTA (red dotted curve) scavengers. Error bars reflect the standard deviations of the triplicate measurements.
