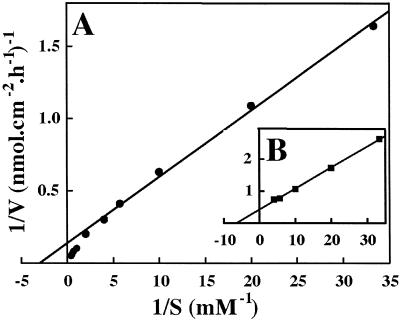
Figure 6.
Lineweaver-Burk plots of 2,4D-Lys uptake. A, Data from Figure 5A (●); B, data from Figure 5B after subtracting the CCCP-insensitive component; (▪), active component. Using Eadie-Hofstee plots, the points corresponding to the highest concentrations (1.5, 2.0, and 2.5 mm) parallel the vertical axis.

