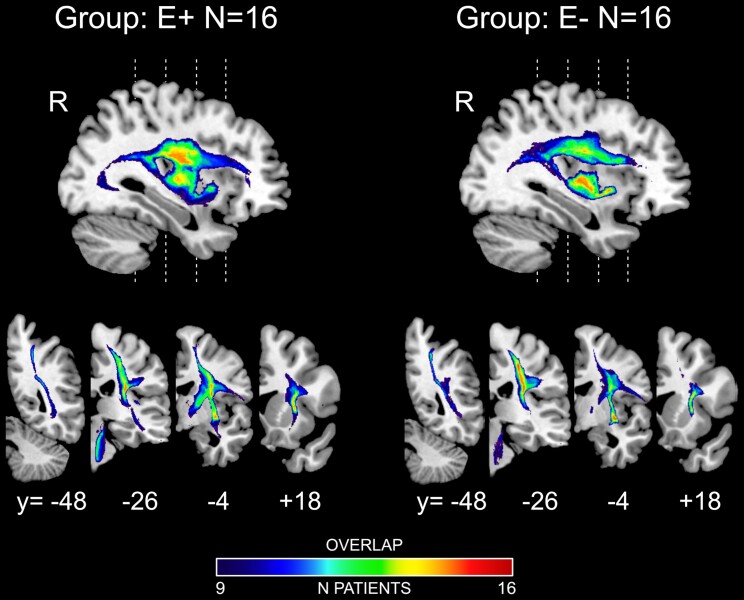
Figure 2.
Disconnectome maps. Disconnectome maps resulting from individual lesions averaged across the restricted cohort of E+ (N = 16) and E− (N = 16) patients. Each map is overlaid on MNI template and presented in one medial parasagittal (x = +36 in MNI space), and four representative right coronal sections (numbers indicate y-coordinates in MNI space). The colour bars indicate the number of overlapping disconnectome maps.

