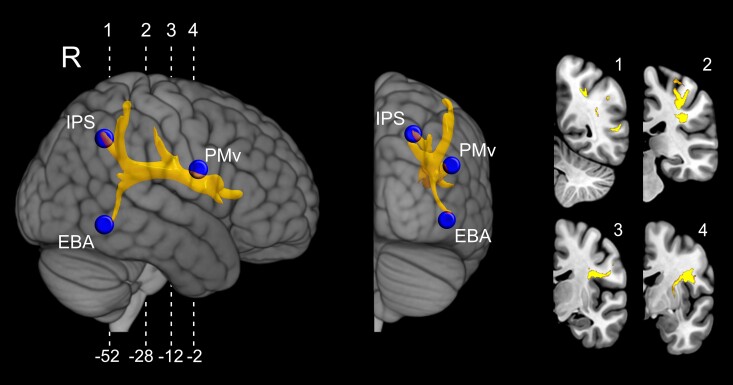
Figure 5.
Representation of the tracts damaged more frequently in the E+ group with respect to the E− groups. The tract results from the regional subtraction between the normalized and thresholded fibre tracts reconstructed using the E+ and E− lesion waypoints. The resulting tract is shown from lateral right and posterior 3D views of an MNI stereotaxic template with projection on cortical surface, and in four coronal representative slices, taken at the level shown in the lateral view.

