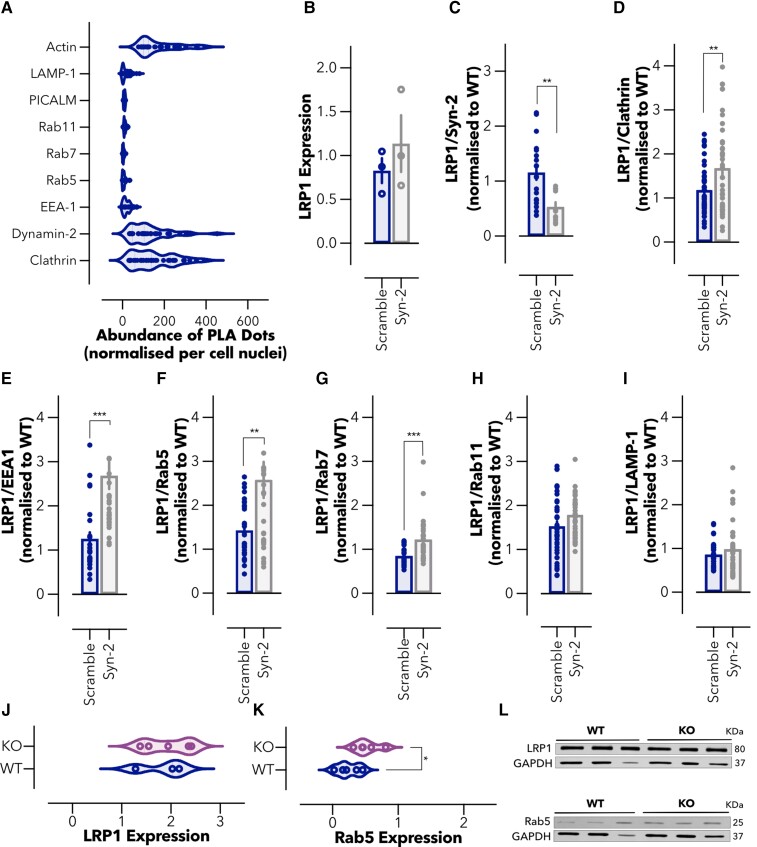
Figure 2.
Balance between the vesicular and tubular trafficking of LRP1 in the brain endothelium. (A) Abundance of PLA dots resulting from the proximity between syndapin-2 and intracellular proteins associated with endocytosis and trafficking of LRP1 and Aβ in BECs. Violin plot (n = 30–40 images, 10–20 images of different cells from three independent experiments). (B) Expression levels of LRP1 in the shRNA control (scramble) and syndapin-2 knockdown (Syn-2) BECs determined by Western blotting. Values normalized to WT BECs. Each data point represents normalized LRP1 expression levels in one cell sample. GAPDH was used as loading control. Mean ± standard deviation (SD) (n = 3). Non-significant, Student’s t-test. Abundance of PLA dots resulting from the proximity between LRP1 and (C) syndapin-2, (D) clathrin, (E) EEA-1, (F) Rab5, (G) Rab7, (H) Rab11 and (I) LAMP-1 in scramble and syndapin-2 knockdown BECs. All data were normalized to WT BECs. Each point represents abundance of PLA dots in one image. Mean ± SD (n = 30–40 images, 15–20 images of different cells from two independent experiments). **P < 0.01, ***P < 0.001, Student’s t-test. (J) LRP1 and (K) Rab5 expression levels in the microvessels of WT and heterozygous syndapin-2 KO mouse brains quantified by densiometry analyses of immunoblotting. Data normalized to GAPDH (loading control). Violin plot (n = 3−5). *P < 0.05, Student’s t-test. (L) Representative immunoblotting for LRP1, Rab5 and GAPDH (as loading control) in the microvessel fractions of WT and KO mouse brains. For full blots of the data represented in B–L, see Supplementary Fig. 8.

