Figure 3.
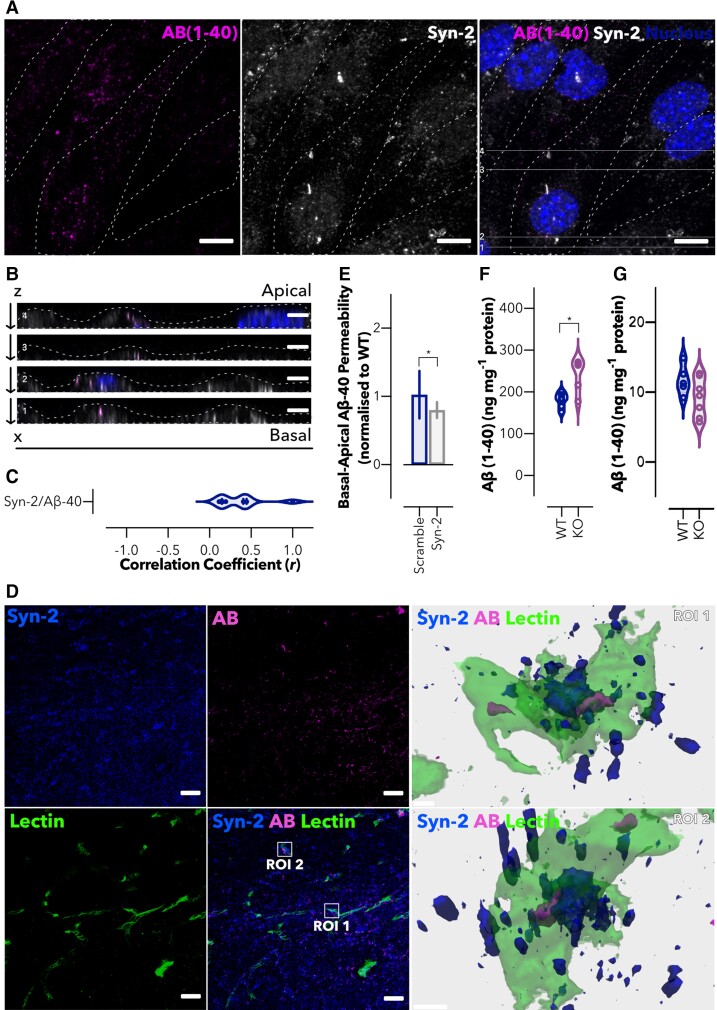
Syndapin-2 transports Aβ across the brain endothelium. (A) In vitro colocalization of Aβ (1–40) (in magenta) and syndapin-2 (in white) in polarized BECs treated with FAM-Aβ (1–40) for 5 min. Nuclei are shown in blue. Dotted line represents the cell membrane limits. Scale bar: 10 µm. (B) Z-projections of BECs show the colocalization of syndapin-2 with Aβ (1–40) during basal-to-apical transport. Dotted lines represent the cell membrane limits. Scale bar: 5 µm. (C) Quantification of colocalization of syndapin-2 and Aβ (1–40) within the polarized BECs. Violin plot (n = 10 images from different cells from two independent experiments). (D) Representative confocal image of the hippocampal region of a mouse brain showing syndapin-2 (in blue), Aβ (in magenta) and lectin-labelled blood vessels (in green). Scale bar: 20 µm. 3D reconstructions of a z-stack of two ROI showing close interaction of syndapin-2 and Aβ in the brain blood vessels in the left panel. Scale bar: 5 µm. (E) In vitro permeability of FAM-Aβ (1–40) across polarized shRNA control (scramble) and syndapin-2 knockdown (Syn-2) in a basal-to-apical (brain-to-blood) direction. Permeability values were normalized to WT BECs. Each data point represents the permeability of Aβ across a transwell membrane normalized to WT. Mean ± SD (n = 15). *P < 0.05, Student’s t-test. Quantification of Aβ (1–40) in the (F) brain and (G) plasma of WT and syndapin-2 KO animals. Each data point represents the levels of Aβ in one animal. Mean ± SD (n = 5−6). *P < 0.05, Student’s t-test.

