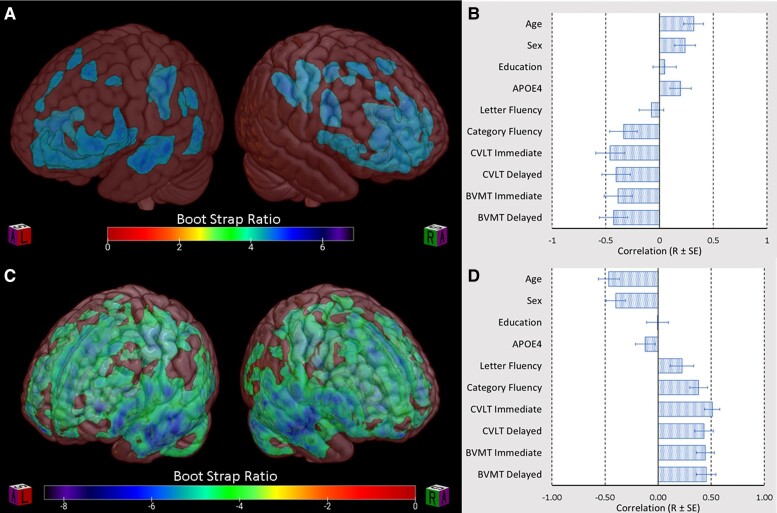
Figure 1.
Latent variables identified by PLS analysis. (A and C) BSR maps depicting voxels which make a reliable contribution to latent variable one, thus representing the spatial distribution of (A) Aβ and (C) grey matter atrophy most strongly correlated with demographic variables and cognitive performance. (B and D) Bar graphs representing bootstrap estimated Pearson correlations with standard error (R ± SE) of the latent variable identified in (B) Aβ PLS and (D) grey matter volume PLS with select demographic variables and cognitive performance. (B) The first latent variable of the Aβ analysis was correlated with age (R = 0.27 ± 0.11, P = 0.014), male sex (R = 0.27 ± 0.10, P = 0.006), number of APOE4 alleles (R = 0.24 ± 0.11, P = 0.028), immediate verbal recall (R = −0.46 ± 0.07, P < 0.001), delayed verbal recall (R = −0.39 ± 0.09, P < 0.001), immediate visual-spatial recall (R = −0.39 ± 0.08, P < 0.001), delayed visual-spatial recall (R = −0.45 ± 0.08, P < 0.001) and Category Fluency (R = −0.33 ± 0.11, P = 0.002) but not Letter Fluency (R = −0.05 ± 0.12, P = 0.705) years of education (R = 0.04 ± 0.10, P = 0.676). (D) The first latent variable of the grey matter volumetric analysis correlated with age (R = −0.46 ± 0.10, P < 0.001) and male sex (R = −0.40 ± 0.09, P < 0.001), immediate verbal recall (R = 0.51 ± 0.07, P < 0.001), delayed verbal recall (R = 0.43 ± 0.09, P < 0.001), immediate visual-spatial recall (R = 0.44 ± 0.09, P < 0.001), delayed visual-spatial recall (R = 0.45 ± 0.09, P < 0.001), Category Fluency (R = 0.38 ± 0.08, P < 0.001) and Letter Fluency (R = 0.22 ± 0.11, P = 0.044) but not years of education (R = 0.00 ± 0.10, P = 0.968) or number of APOE4 alleles (R = −0.12 ± 0.09, P = 0.201). BVMT-R, Brief Visual Memory Test-Revised; CVLT, California Verbal Learning Test.

