
Figure 2. Smoking urge, cigarette and e-cigarette desire response to the cigarette cue across groups.
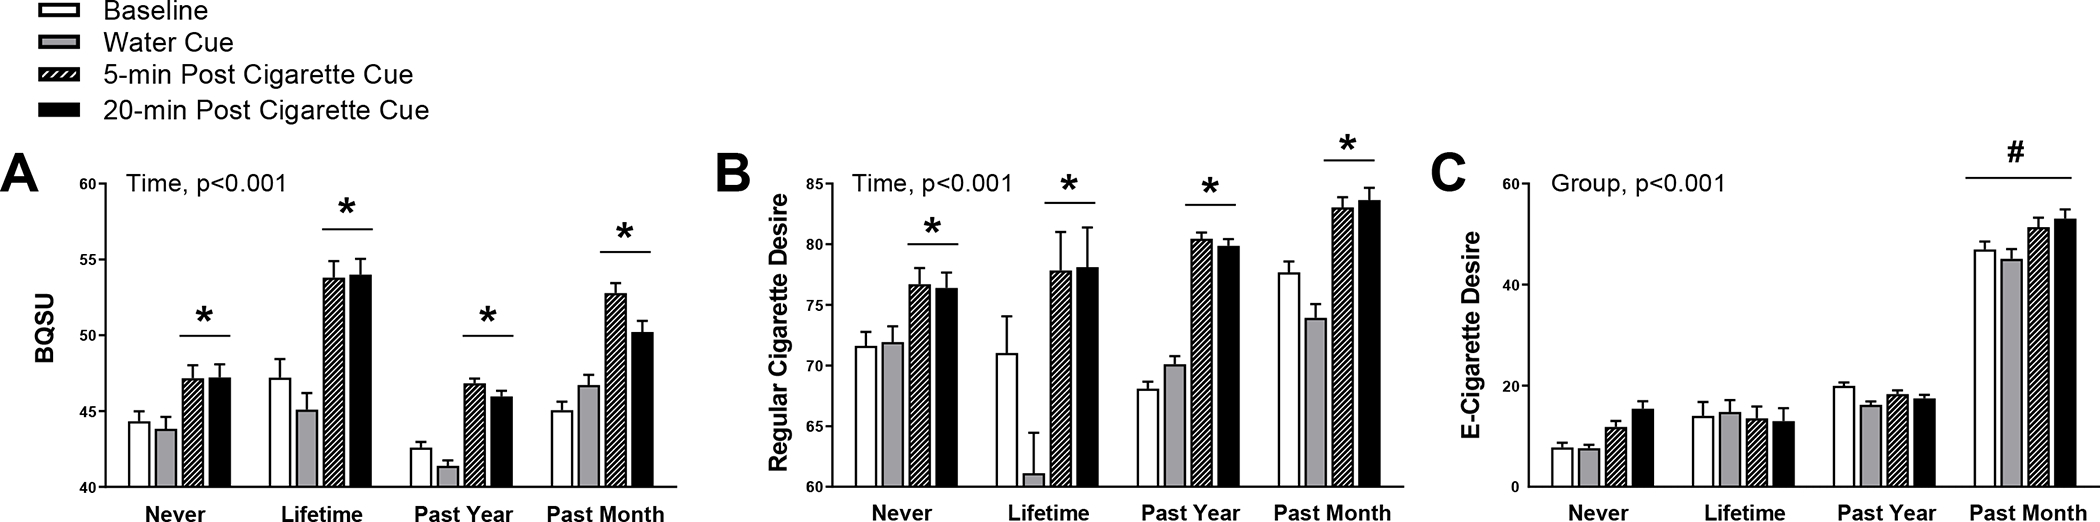
Data are Mean ± SEM. Subjective ratings of smoking urge (A), cigarette desire (B), and e-cigarette desire (C) occurred on a visual analog scale ranging from 0–100. The time points include baseline, 5 minutes following delivery of a water cue, and 5 and 20 minutes after delivery of the vaping cue. *p < 0.05 for 5-min=20-min > Baseline=Water cue; #p < 0.05 for past month > past year=lifetime=never