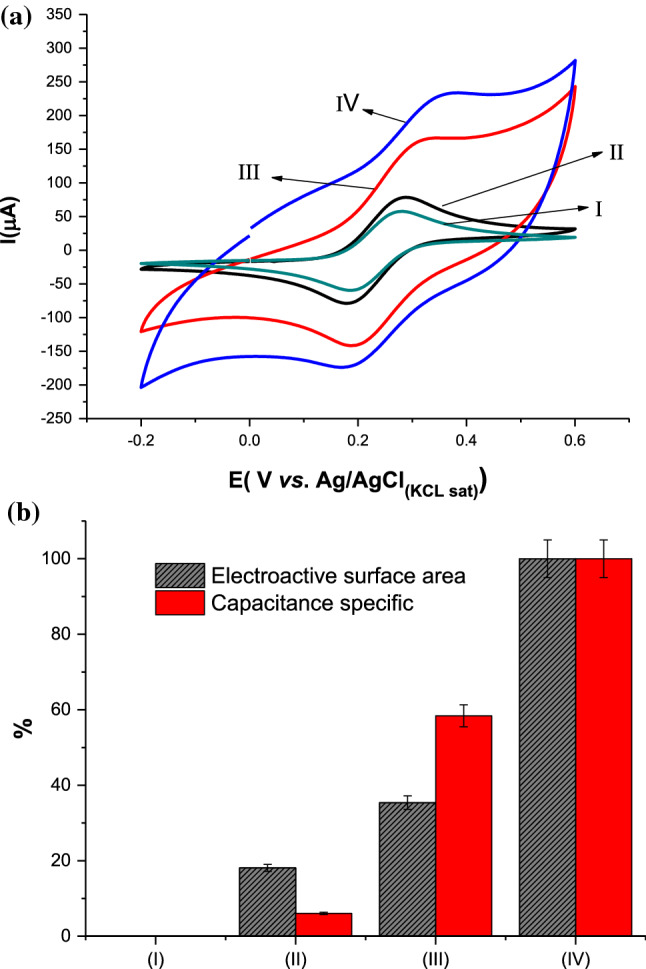
Figure 1.

a Typical CVs measured at 80 mV s−1, and b Bar plot of the electroactive areas and Capacitance specific (means of three replicates): (I) Bare GCE; (II) GO/GCE; (III) PPy/GCE, and (IV) PPy–GO/GCE. Bar error represents the standard deviations of three replicates. All measurements were performed in 0.005 mol L−1 of K3Fe(CN)6/K4Fe(CN)6 prepared in 0.1 mol L−1 KCl as redox probe
