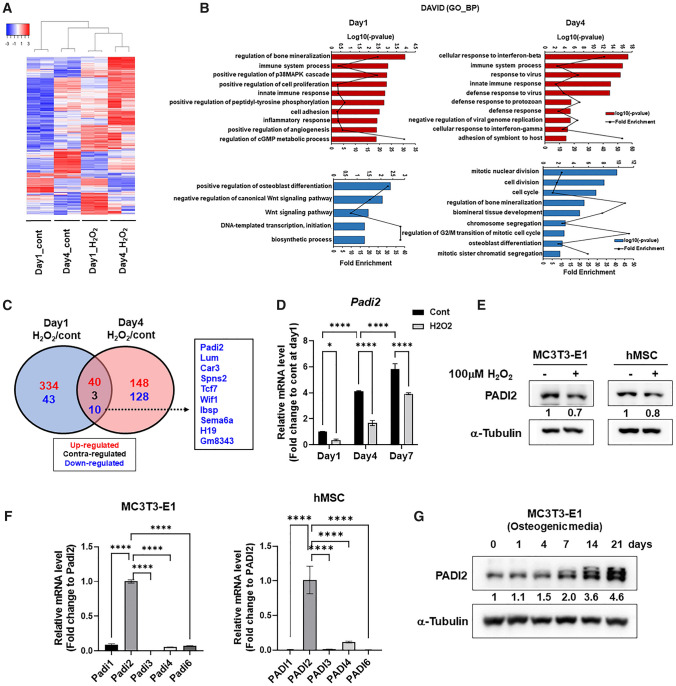
Fig. 1.
ROS induce the reduction of PADI2 level in murine- and human-derived mesenchymal lineage cells. A Hierarchical clustering analysis of 706 DEGs from MC3T3-E1 cells treated with or without 100 μM H2O2 for 1 or 4 days in osteogenic medium (fold change, 1.5; log2-normalized read count of ≥ 5; P < 0.05). B DAVID GO term analysis for biological processes of the upregulated (Red) or downregulated (Blue) genes on each day. C The Venn diagram shows the numbers of DEGs with shared and unique expression between day 1 and day 4. Commonly downregulated genes are listed in the right box. D MC3T3-E1 cells were treated with or without 100 μM H2O2 in the osteogenic medium for each indicated period. The Padi2 mRNA level was determined by RT-qPCR and the fold change in mRNA levels was calculated by normalization to Gapdh. Data are presented as the mean of three replicates; bars, ± SD; statistical significance was determined using two-way ANOVA for multiple comparisons, *P < 0.05, ****P < 0.0001. E Western blot analysis of PADI2 in MC3T3-E1 and hMSC treated with or without 100 μM H2O2 for 24 h. Protein level is quantified using ImageJ and normalized with a-Tubulin. After normalization, fold changes of treated /non-treated control are presented. F RT-qPCR of PADI isoforms in MC3T3-E1 and hMSC. Data are presented as the mean of three replicates; bars, ± SD; statistical significance was determined using one-way ANOVA for multiple comparisons, ****P < 0.0001. G Western blot analysis of PADI2 expression levels at the indicated time points during osteogenic differentiation of MC3T3-E1. Protein level is quantified using ImageJ and normalized with a-Tubulin. After normalization, fold changes to day0 are presented

