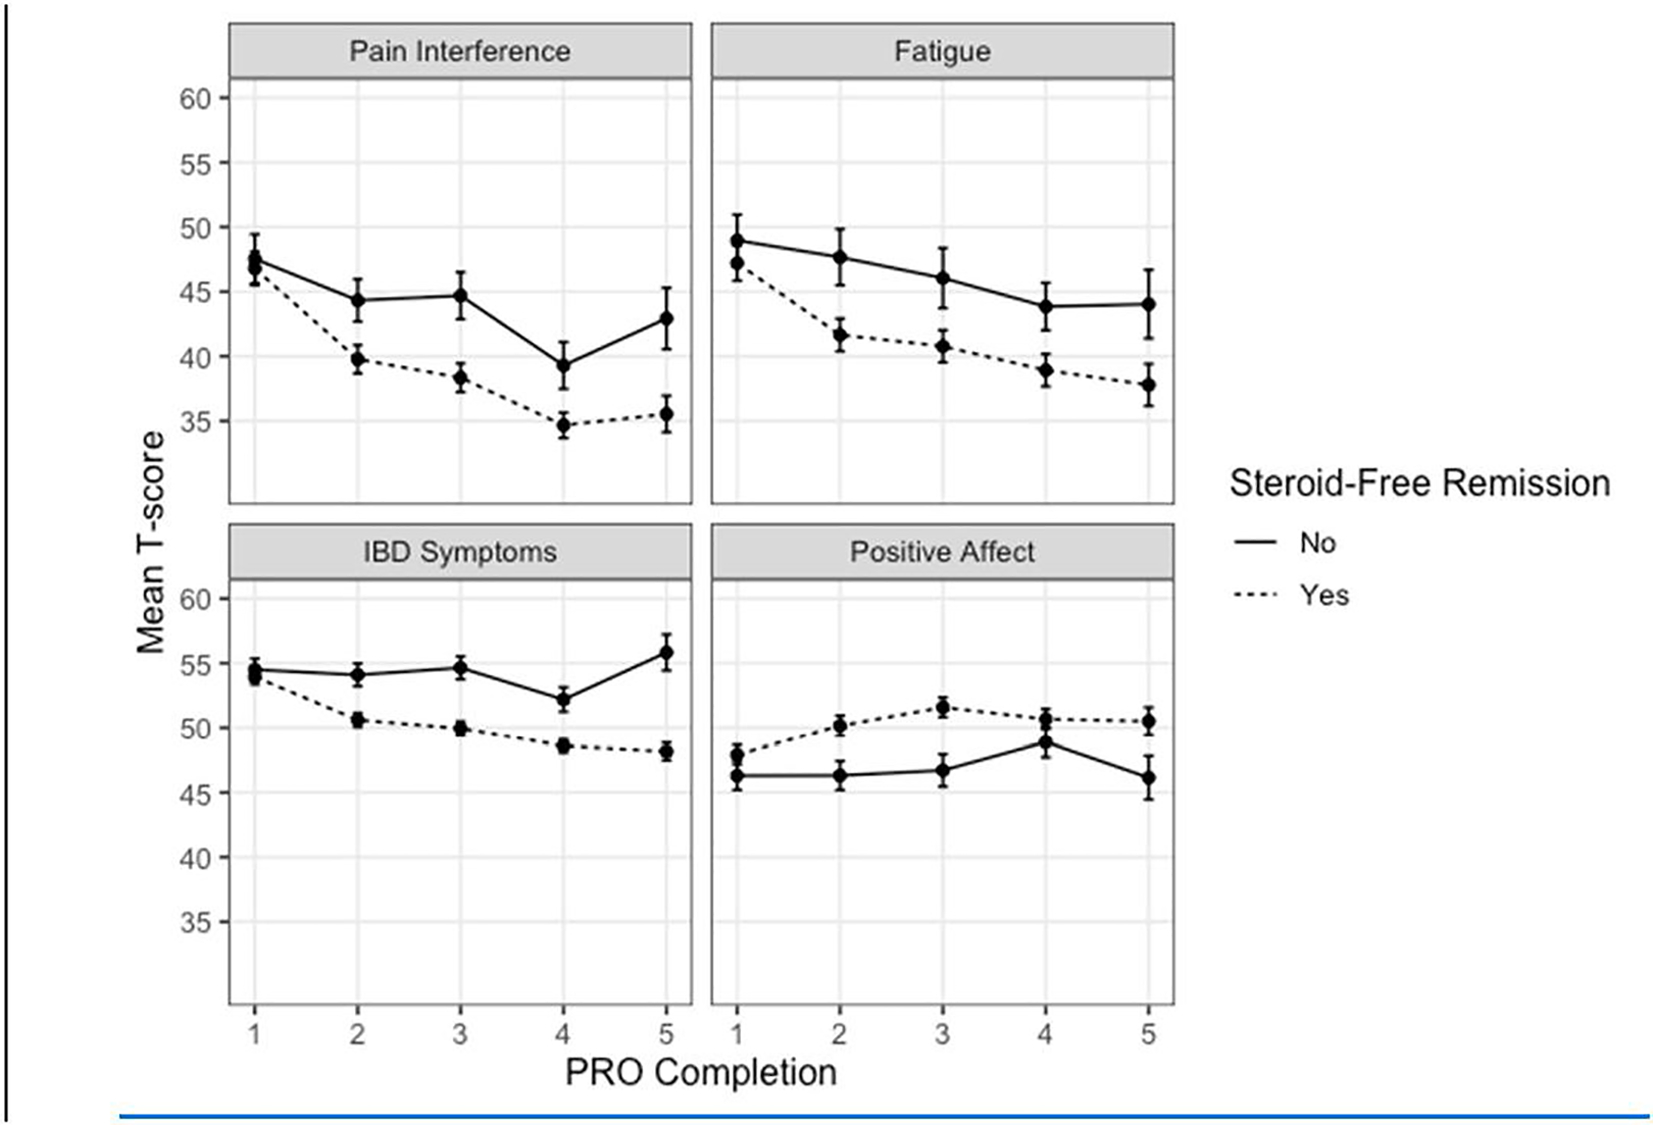
Figure 1.

Mean T-scores for 187 participants that remained in the study and completed PROs for at least one year post-baseline. Means were calculated by the order of PRO completion (1 = baseline, 2 = participants’ first follow-up PRO, etc.) up to participants’ fourth follow-up PRO. Higher scores indicate worse outcomes on Pain Interference, Fatigue, and IBD symptoms and better outcomes on Positive Affect. Bars represent the standard error of the mean.
