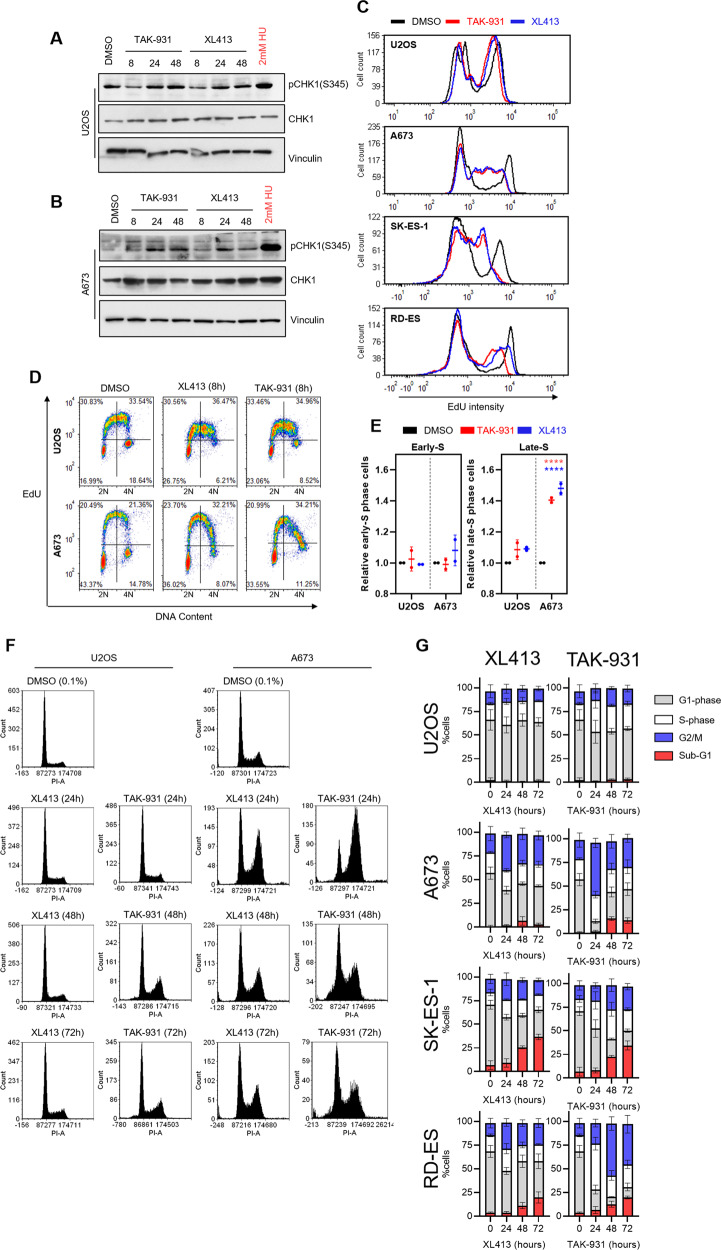
Fig. 2. DDK inhibition disrupts DNA replication and alters cell cycle progression in Ewing sarcoma cells.
A, B U2OS (A) and A673 (B) cells were treated with 1 µM XL413 or 300 nM TAK-931 for the indicated timepoints. Protein lysates were collected, and a western blot was performed to analyze the relative levels of the indicated proteins. 2 mM hydroxyurea (HU) was used as a positive control for replication stress induction. C Cells were treated with 0.1% DMSO, 1 µM XL413 or 300 nM TAK-931 for 8 h followed by a 1-h incubation with 10 µM EdU. Cells were then fixed and stained for EdU and relative EdU intensity was measured using FACS. Representative experiment of 3 biological replicates is shown. D U2OS and A673 cells were treated with either 0.1% DMSO, 1 µM XL413, or 300 nM TAK-931 for 8 h followed by a 1-h incubation with 10 µM EdU. Cells were then fixed and stained for EdU (Alexa-fluor 488) and DNA content (PI) and analyzed using FACS. Representative dot plots of 2 biological replicates are shown. E Quantification of panel D. Specifically, calculations were done by dividing the percentage of cells in the upper right-hand quadrant (late-S phase) by the total number of cells in the upper left and upper right quadrants (total S-phase cells), relative to DMSO treated control cells (n = 2 biological replicates) 2-way ANOVA Dunnett’s multiple comparison test, ****p < 0.0001. Bars represent mean and standard deviation. F Cells were treated with 1 µM XL413 or 300 nM TAK-931 for the indicated timepoints. DNA content was stained with PI and analyzed using FACS. Representative histograms of 3 biological replicates are shown. G Quantification of panel F (n = 3 biological replicates).

