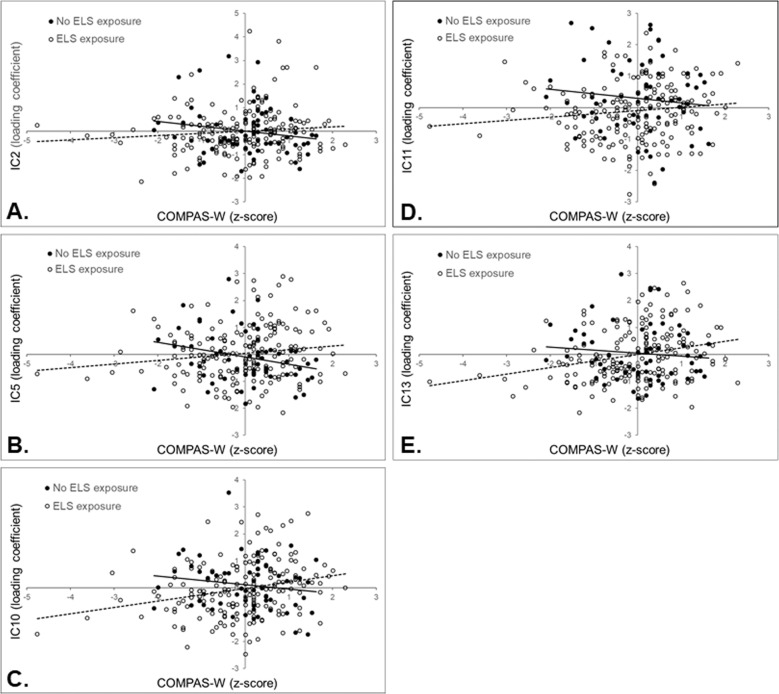
Fig. 2. Graphs of the associations between source-based morphometry independent components (IC) and wellbeing.
These associations are between IC2 (A), IC5 (B), IC10 (C), IC11 (D), and IC13 (E) and wellbeing (indexed by COMPAS-W z-scores) that showed an interaction with early-life stress (ELS) exposure. Participants without exposure showed a significant negative association between the GMC in each component and wellbeing (black dots; solid regression line) for IC2 and IC5, while those with previous exposure displayed a significant positive association between the GMC in each component and wellbeing (white dots; dotted regression line) for IC10 and IC13. The simple slopes for IC11 were not significant.

