
Figure 4.
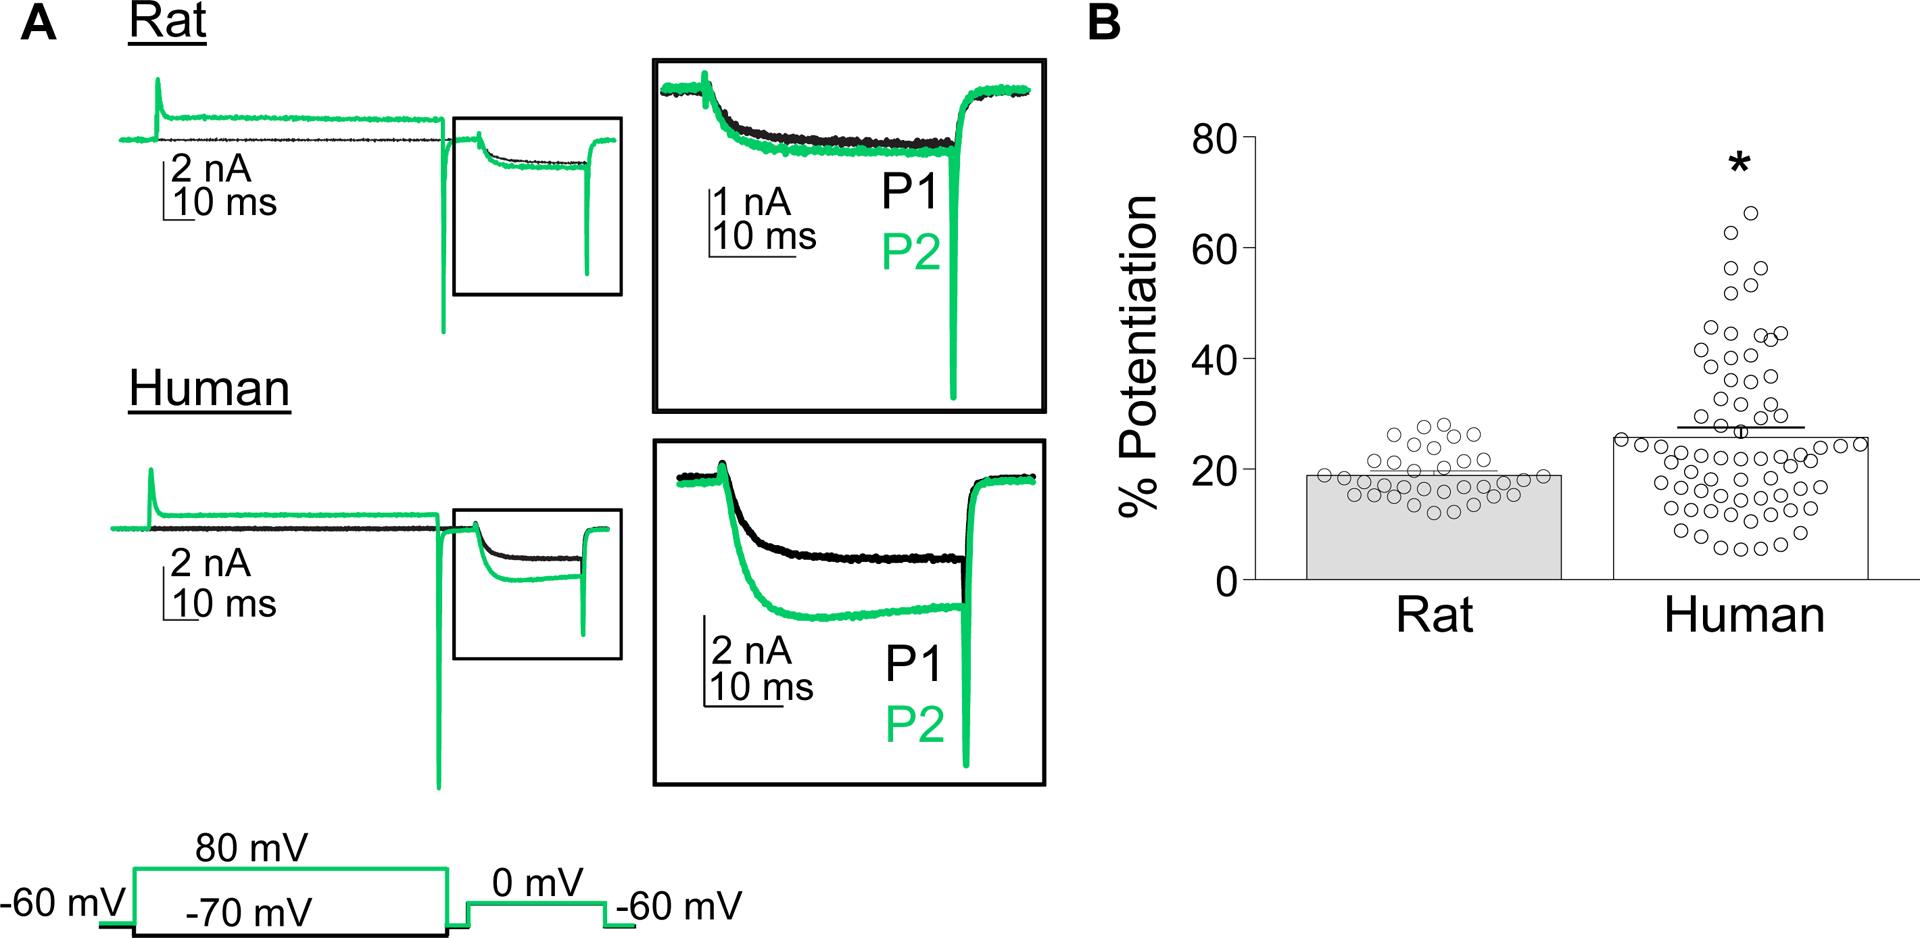
Pre-pulse potentiation in rat and human neurons. (A) Pre-pulse potentiation was assessed by comparing the current evoked at 0 mV following a 500 ms conditioning voltage step to either −70 mV (black trace) or +80 mV (green trace). Inset: Magnified view of the current evoked during the test pulse. (B) Variability in the pre-pulse potentiation (% Potentiation) of HVA currents in rat and human DRG neurons. Data are mean ± SEM. * is p < 0.05.