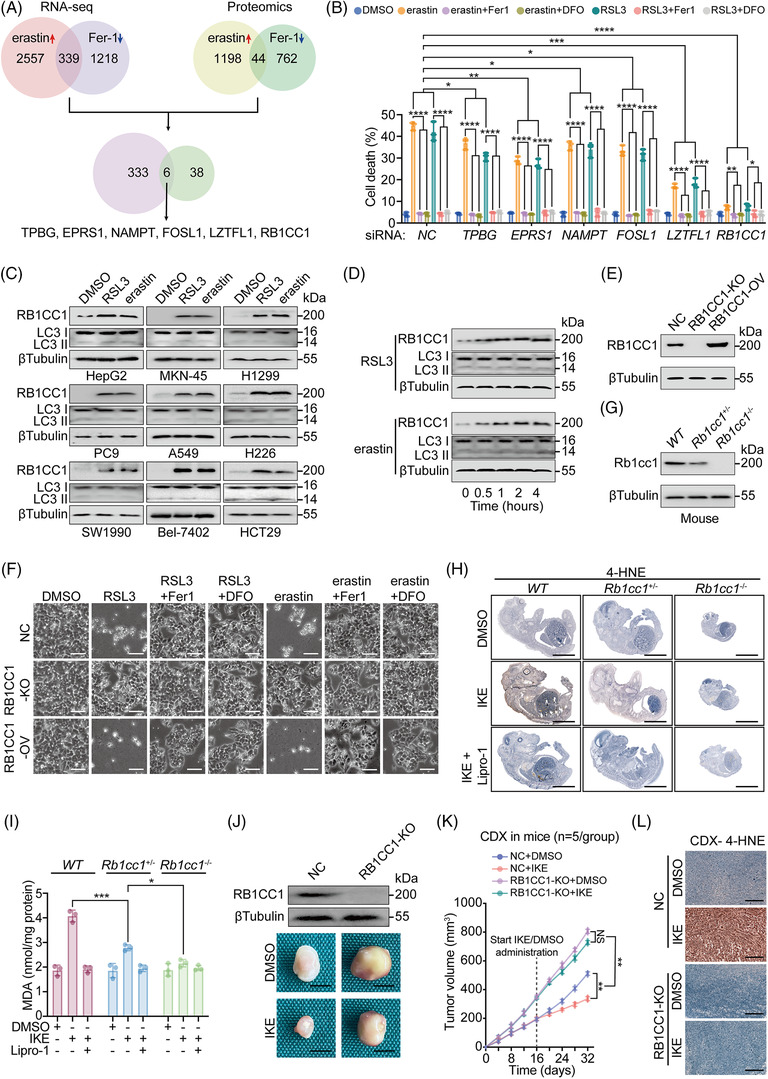
FIGURE 1.

RB1CC1 sensitises tumour cells to ferroptosis. (A) Venn diagram showing RNA‐seq and proteomics results in HepG2 cells treated with erastin (10 μM) or Fer‐1 (2 μM) for 4 h. (B) Cell death, as measured by SYTOX green staining followed by cytometry in HepG2 cells transfected with siRNA, as indicated. HepG2 cells were also treated with DMSO, erastin (10 μM) or RSL3 (1 μM), with or without of Fer‐1 (2 μM) or DFO (100 μM) for 12 h. (C) IB of RB1CC1 and LC3 expression in a serial of tumour cells, as indicated, following treating with DMSO, RSL3 (1 μM) or erastin (10 μM) for 4 h. (D) IB of RB1CC1 and LC3 in HepG2 cells following treating with RSL3 (1 μM) or erastin (10 μM) for the indicated hours. (E) RB1CC1 expression efficiency for KO or overexpression (OV) of RB1CC1 in HepG2 cells. (F) Morphological changes of HepG2 cells following treating with DMSO, RSL3 (1 μM) or erastin (10 μM), with or without Fer‐1 (2 μM) or DFO (100 μM) for 12 h. Scale bar, 75 μm. (G) Rb1cc1 expression in WT, Rb1cc1+/– and Rb1cc1–/‐ mouse foetuses. (H and I) 4‐HNE (H) and malondialdehyde (MDA) (I) in WT, Rb1cc1+/– and Rb1cc1–/‐ mouse foetuses obtained from cesarean section at E19 following pre‐administration with IKE (50 mg/kg), with or without liproxstatin‐1 (Lipro‐1) (10 mg/kg) in pregnant female mice for 2 days. Scale bar, 3 mm. (J–L) Representative images (J), tumour growth curve (K) and 4‐HNE concentration (L) of cell‐derived xenograft (CDX) that generated by Bel‐7402 cells with or without RB1CC1 KO, and mice were administered with DMSO or IKE (50 mg/kg). Scale bar, 2 mm (J) and 200 μm (L). Statistical analysis was performed by one‐way analysis of variance (ANOVA) (B), Student's t‐test (I) or two‐way ANOVA (K). Data are presented as means ± SD from indicated samples. ****p < .0001, ***p < .001, **p < .01, *p < .05, indicates statistical significance and N.S. indicates non‐significance
