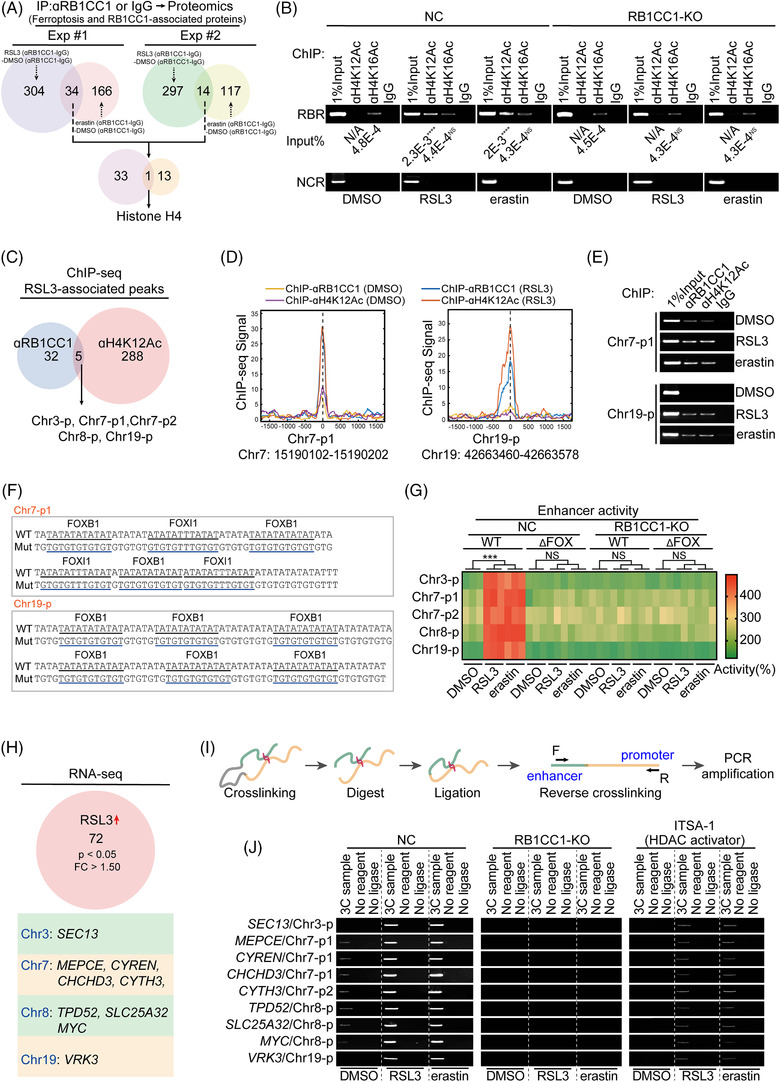
FIGURE 3.

RB1CC1 links with H4K12Ac to mediate ferroptosis‐associated and enhancer‐dependent transcription. (A) Venn diagram showing the protein(s) interacted with RB1CC1 following RSL3 (1 μM) or erastin (10 μM) treatment for 4 h in experiment (Exp) #1 and #2. The proteins immunoprecipitated by anti‐RB1CC1 antibodies were subjected into mass spectroscopy (MS) for further analysis. (B) ChIP experiments for detecting enrichments within the RB1 promoter using anti‐H4K12Ac, anti‐H14K16Ac or control IgG antibodies in control and RB1CC1‐KO HepG2 cells treated with DMSO, RSL3 (1 μM) or erastin (10 μM) for 4 h. ****p < .0001, indicates significance between RSL3 and DMSO, or between erastin and DMSO. N/A indicates not available. (C) Venn diagram showing peaks that revealed to be overlapped in ChIP‐Seq using anti‐RB1CC1 and anti‐H4K12Ac antibodies in HepG2 cells treated with RSL3 (1 μM) for 4 h. (D) The presentation of peaks for Chr7‐p1 and Chr19‐p from ChIP‐Seq experiments in HepG2 cells treated with DMSO or RSL3 (1 μM) for 4 h. (E) Verification of RB1CC1 binding and H4K12Ac histone modification within Ch7‐p1 and Chr19‐p in HepG2 cells treated with DMSO, RSL3 (1 μM) or erastin (10 μM) for 4 h. (F) DNA sequences of Chr7‐p1 and Chr19‐p with WT or mutated forkhead box (FOX)‐binding motifs, as indicated. (G) Heatmap showing the enhancer activity from indicated peaks with or without FOX‐binding motif in control and RB1CC1‐KO HepG2 cells treated with DMSO, RSL3 (1 μM) or erastin (10 μM) for 4 h. (H) RNA‐seq revealed genes that upregulated by RSL3 and located within the same chromosomes include the peaks that reveled by ChIP‐Seq in panel C. (I) Schematic representation of workflow for the chromosome conformation capture (3C) experiments. (J) Promoter–enhancer associations, as revealed by 3C experiment in control and HepG2 cells with RB1CC1 KO or pretreated with inhibitor‐1 of trichostatin A (ITSA‐1) (50 μM, 2 h), in the presence or absence of DMSO, RSL3 (1 μM) or erastin (10 μM) for 4 h. Statistical analysis was performed by Student's t‐test (B) or one‐way ANOVA (G). Data are presented as means ± SD from indicated samples. ****p < .0001, ***p < .001, indicates statistical significance and N.S. indicates non‐significance
