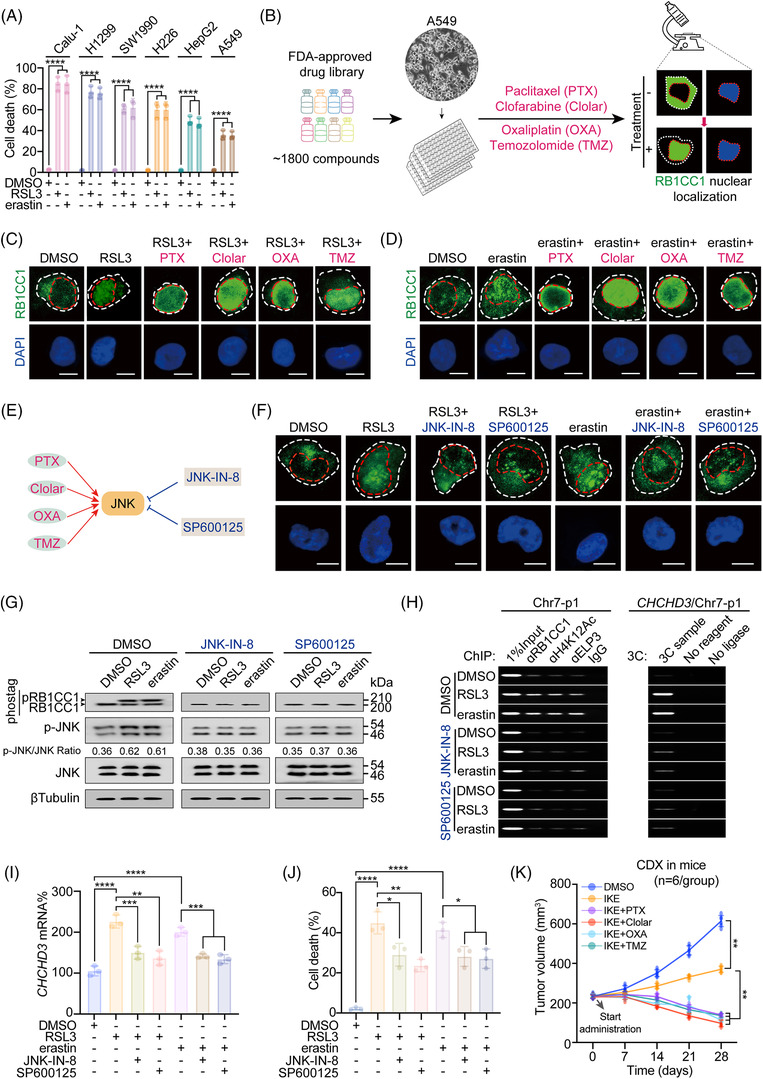
FIGURE 6.

Activating JNK reinforces the role of RB1CC1 to sensitise ferroptosis. (A) Cell death in a serial of tumour cells, as indicated, following treating with DMSO, RSL3 (1 μM) or erastin (10 μM) for 12 h. (B) Workflow of identifying the potential drugs that might stimulate nuclear translocation of RB1CC1 in A549 cells. (C and D) Subcellular localisation of RB1CC1 in A549 cells treated with DMSO, RSL3 (1 μM) (C) or DMSO, erastin (10 μM) (D) for 4 h, in the presence or absence of paclitaxel (PTX) (50 pM), clofarabine (Clolar) (10 μM), oxaliplatin (OXA) (50 μM) or temozolomide (TMZ) (50 μM). Scale bar, 10 μm. (E) Schematic presentation of activators and inhibitors of JNK. (F) Subcellular localisation of RB1CC1 in A549 cells following treating with DMSO, RSL3 (1 μM) or erastin (10 μM) for 4 h, with or without JNK‐IN‐8 (1 μM) or SP600125 (10 μM). Scale bar, 10 μm. (G) Phosphorylation of RB1CC1 and JNK in A549 cells treated with DMSO, RSL3 (1 μM) or erastin (10 μM) for 4 h, with or without JNK‐IN‐8 (1 μM) or SP600125 (10 μM), as measured by gels containing with or without Phostag™. (H) ChIP (left panel) and chromosome conformation capture (3C) experiments (right panel) showing RB1CC1 and ELP3 binding, H4K12Ac histone modification at Chr7‐p1 and CHCHD3 promoter‐Chr7‐p1 association in A549 cells treated with DMSO, RSL3 (1 μM) or erastin (10 μM) for 4 h, with or without JNK‐IN‐8 (1 μM) or SP600125 (10 μM). (I and J) CHCHD3 mRNA (I) and cell death (J) in A549 cells treated with DMSO, RSL3 (1 μM) or erastin (10 μM), with or without JNK‐IN‐8 (1 μM) or SP600125 (10 μM) for 4 h (I) or 12 h (J). (K) Growth of xenografts cell‐derived xenograft (CDX) that generated by A549 cells treated with DMSO or IKE (50 mg/kg), in the presence or absence of PTX (20 mg/kg), Clolar (10 mg/kg), OXA (10 mg/kg) or TMZ (40 mg/kg). The tumour volumes were monitored at indicated time. n = 6 mice/group. Statistical analysis was performed using one‐way ANOVA (A) or Student's t‐test (I and J) or two‐way ANOVA (K). Data are presented as means ± SD from indicated samples. ****p < .0001, ***p < .001, **p < .01, *p < .05, indicates statistical significance
