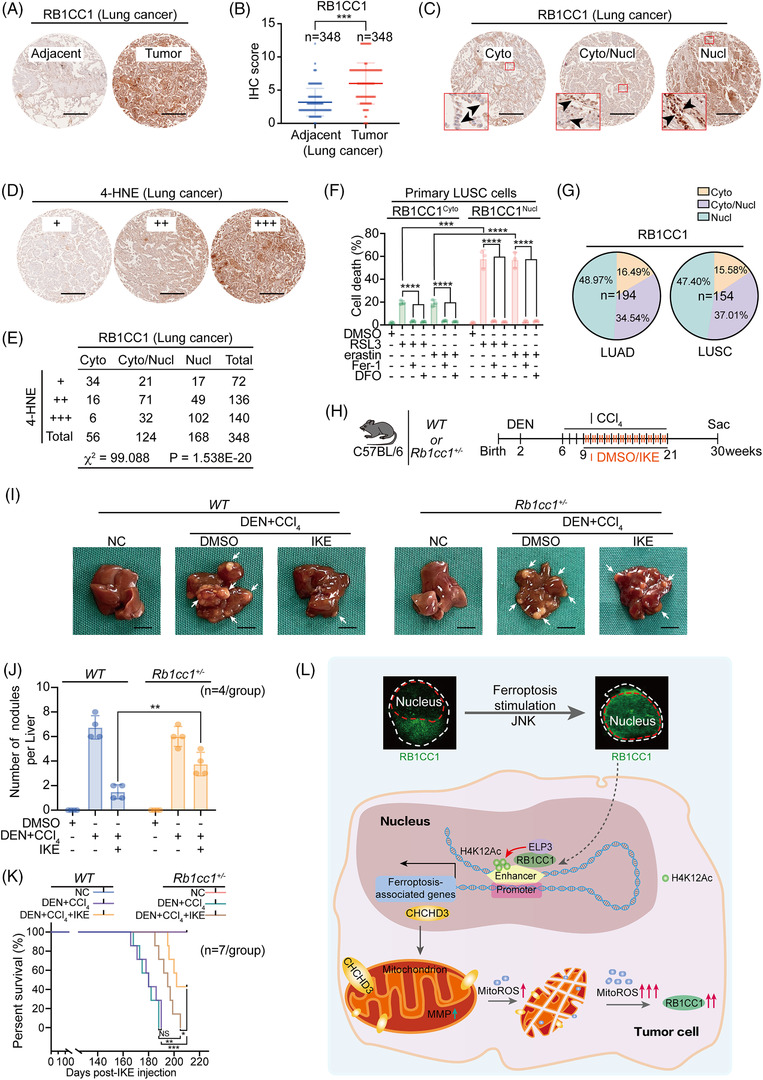
FIGURE 7.

Clinical and translational significance of the study. (A) Representative tissue microarray (TMA) images of RB1CC1 in tumour and paired adjacent lung tissues. Scale bar, 100 μm. (B) Immunohistochemistry (IHC) scores for evaluating RB1CC1 in tumour and paired adjacent lung tissues from TMA. n = 348/group. (C) Representative TMA images for different subcellular localisation of RB1CC1 in lung cancer. Arrow heads indicate RB1CC1 subcellular localisation. (D) Representative IHC images for 4‐HNE in TMA that same as the ones in panel C. (E) The association between RB1CC1 and 4‐HNE in lung cancer, as evaluated by χ 2‐test. (F) Cell death in primary lung squamous cell carcinoma (LUSC) cells with distinct cytosol and nuclear subcellular localisation of RB1CC1 following treating with DMSO, RSL3 (1 μM) or erastin (10 μM), in the presence or absence of Fer‐1 (2 μM) or DFO (100 μM) for 12 h. (G) The percentage of different subcellular localisation of RB1CC1 in lung adenocarcinoma (LUAD) (n = 194) and LUSC (n = 154). (H) Workflow for mice treatment. (I) Macroscopic liver appearance of WT or Rb1cc1+/– mice treated with or without diethylnitrosamine (DEN) and carbon tetrachloride (CCl4) and administered with DMSO or IKE. n = 4 mice/group, scale bar, 10 mm. (J) Tumour burden in mice liver from panel I. (K) Survive curve for mice under the same treatment as that in panel I. (L) Schematic presentation of the present study. Briefly, nuclear translocation of RB1CC1 occurs upon induction of ferroptosis. Nuclear RB1CC1 recruits histone acetyltransferase ELP3, which facilitates H4K12Ac histone modification within enhancers. Such effects reinforce enhancer–promoter association and finally stimulate ferroptosis‐associated transcriptional reprogramming. CHCHD3 is such a target gene of RB1CC1. Trigger of ferroptosis stimulates RB1CC1 and CHCHD3‐dependent mitochondrion function at a very early stage, which is essential for initiating an increase of mitoROS). As a consequence, tumour cells to ferroptosis are sensitised. Statistical analysis was performed using Student's t‐test (B, F, J) or one‐way ANOVA (F), survival curves (K) were compared with the log‐rank test. Data are presented as means ± SD from indicated samples. ****p < .0001, ***p < .001, **p < .01, *p < .05, indicates statistical significance and N.S. indicates non‐significance
