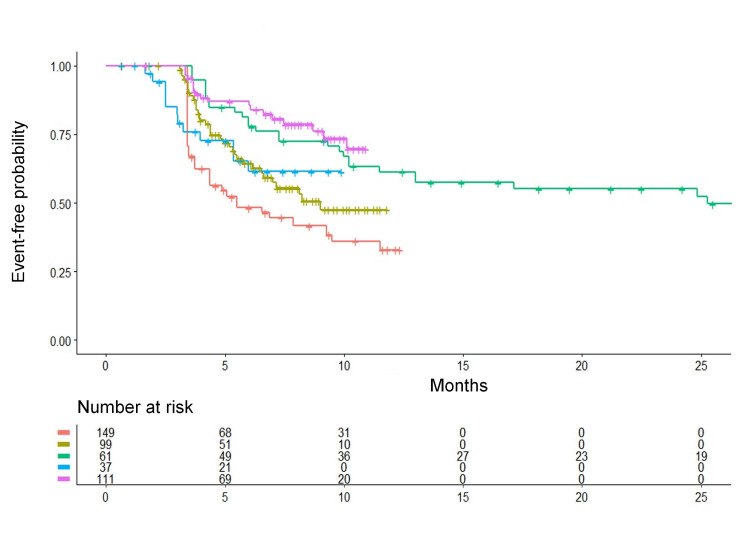
Figure 3. Kaplan-Meier time-to-event curves generated from reconstructed patient-level data.
The curves refer to the five control groups receiving medical therapy in the five randomized trials. Relapse of atrial fibrillation or of another atrial arrhythmia is the time-to-event end-point (see text for further details). Identification of the control groups of the five trials: in red, Andrade et al. (2021) [1] (n = 149); in dark green, Wazni et al. (2021) [2] (n = 99); in light green, Morillo et al. (2014) [3] (n = 61); in blue, Wazni et al. (2005) [4] (n = 37); in purple, Kuniss et al. (2021) [5] (n = 111). n is the number of patients.

