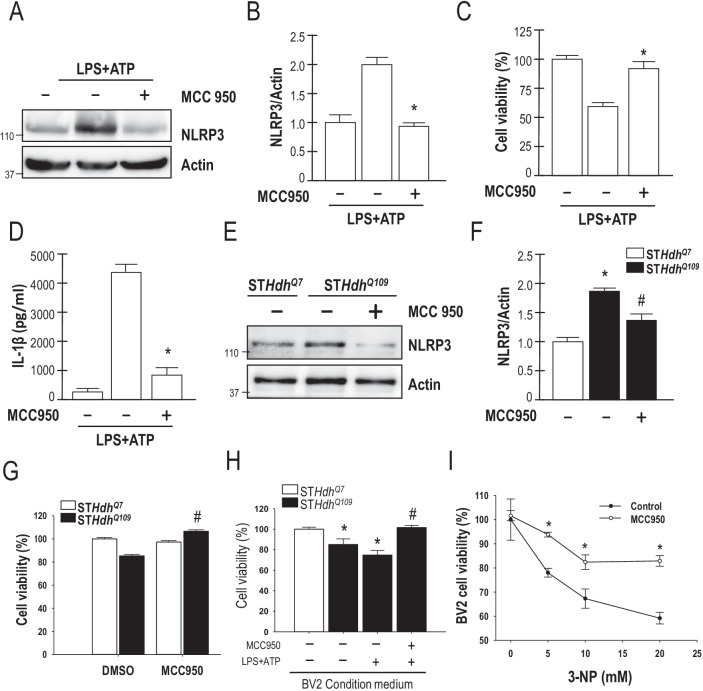
Fig. 1.
MCC950 markedly reduces cytotoxicity in striatal progenitor cells and BV2 microglial cells. A, B BV2 microglia were incubated for 4 h with LPS (1 μg/mL) followed by incubation with MCC950 (1 μM) for 2 h. The cells were then incubated with ATP (1 mM, 24 h). Total lysates of BV2 microglial cells were assessed by Western blot analysis to determine the levels of the NLRP3 and actin proteins. The molecular mass is indicated in kilodaltons. C, D BV2 microglia were incubated for 4 h with LPS (1 μg/mL) followed by incubation with MCC950 (1 μM) for 2 h. The cells were then incubated with ATP (1 mM for 24 h). Cell survival (C) and IL-1β expression levels (D) were measured using the CCK-8 assay and ELISA, respectively. The values of the indicated cells were normalized to those of untreated BV2 cells. *P < 0.05 compared to LPS/ATP treated cells (n = 3). E, F STHdhQ109 cells were incubated for 24 h with MCC950 (1 μM). Total lysates of STHdhQ7 and STHdhQ109 cells were assessed using Western blot analysis. G STHdhQ7 and STHdhQ109 cells were incubated for 24 h with MCC950 (1 μM). Cell death was quantified using the CCK-8 assay; the values of the indicated cells were normalized to those of untreated STHdhQ7 cells. The data are presented as the mean ± SEM from three independent experiments. *P < 0.05, STHdhQ7 vs. STHdhQ109 cells; #P < 0.05 vs. untreated STHdhQ109 cells. H BV2 cells were incubated with LPS (1 µg/mL for 4 h) with or without MCC950 for 2 h before stimulation with ATP (1 mM for 24 h). The BV2 medium was then collected and used to culture the STHdhQ109 cells for an additional 24 h. STHdhQ7 and STHdhQ109 cell viability was determined by CCK-8 assay. The data are presented as the mean ± SEM from three independent experiments. *P < 0.05, STHdhQ7 vs. STHdhQ109 cells; #P < 0.05 vs. untreated STHdhQ109 cells. I BV2 cells were treated with or without MCC950 (1 μM) and 3-NP (5, 10, and 20 mM) for 24 h. The cell viability was determined using the CCK-8 assay. Data are presented as the mean ± SEM from three independent experiments. *P < 0.05 compared with controls (n = 3)

